SurveyDu
Transforming Digital Survey Collection into an Intelligent Mobile-First Experience
SurveyDu is a modern survey management platform that enables organizations to create, distribute, manage, and analyze surveys through both web and mobile applications. Designed for businesses, researchers, educational institutions, NGOs, and field teams, the platform simplifies the complete survey lifecycle—from survey creation and participant management to real-time response collection and reporting.
The project focused on building an intuitive ecosystem where administrators can create dynamic surveys using configurable JSON structures while respondents enjoy a seamless mobile experience. As the Lead UI/UX Designer, my objective was to reduce complexity, improve completion rates, and create a scalable interface capable of supporting surveys of varying lengths, question types, and business requirements across multiple devices.
The Challenge
Complex Survey Creation
Creating dynamic surveys with multiple question types, conditional logic, and configurable JSON structures often becomes overwhelming for administrators. The challenge was to simplify the survey builder while maintaining complete flexibility.
Improve Survey Completion Rate
Long forms frequently lead to user drop-offs. The experience needed to keep respondents engaged through clear progress indicators, logical question grouping, and a distraction-free interface.
Multi-Platform Consistency
The platform required a unified experience across desktop and mobile while maintaining design consistency, responsive layouts, and intuitive navigation.
Offline Data Collection
Field researchers often work in areas with limited internet connectivity. The application needed to support offline data capture and synchronize responses securely once connectivity became available.
User Research & Insights
Respondents Prefer Short, Guided Experiences
Users were more likely to complete surveys when questions were grouped into smaller logical sections with visible progress indicators and simplified navigation.
Administrators Need Flexible Survey Management
Survey creators wanted reusable templates, configurable question types, and dynamic JSON-based structures instead of rebuilding surveys from scratch.
Mobile Usage Dominates Field Operations
Over 0% of field data collection activities occur on smartphones, making responsive mobile-first design essential for successful survey completion.
Real-Time Reporting Improves Decisions
Stakeholders valued instant dashboards and visual analytics that transformed collected responses into actionable insights without manual processing.
Ideation & Logic
Designing a Frictionless Survey Journey
The overall experience was redesigned around a simplified user journey where respondents can register, receive assigned surveys, complete questionnaires, submit responses, and review submission status with minimal effort. Survey administrators benefit from structured workflows for survey creation, participant management, JSON configuration, and analytics, ensuring both usability and scalability across the platform.
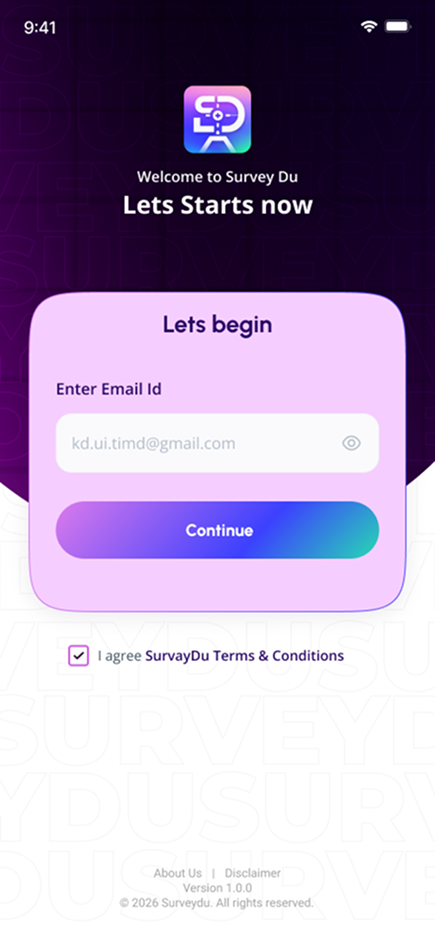
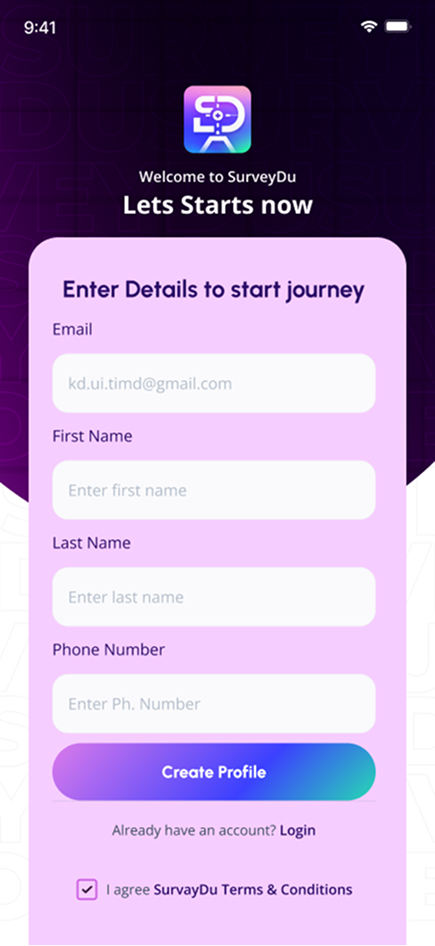
Secure onboarding through email or mobile verification.
Users receive assigned surveys based on projects or campaigns.
Dynamic question rendering using configurable JSON structures with validation.
Responses are securely submitted or stored locally for offline synchronization.
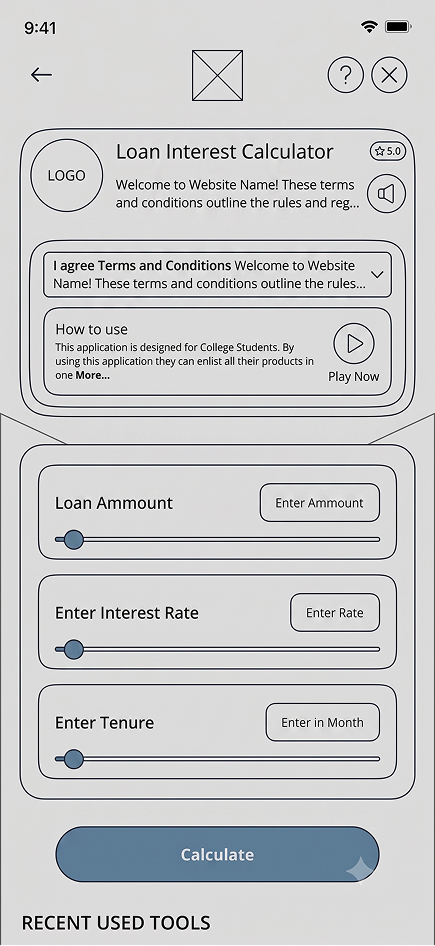
Wireframes & Iteration
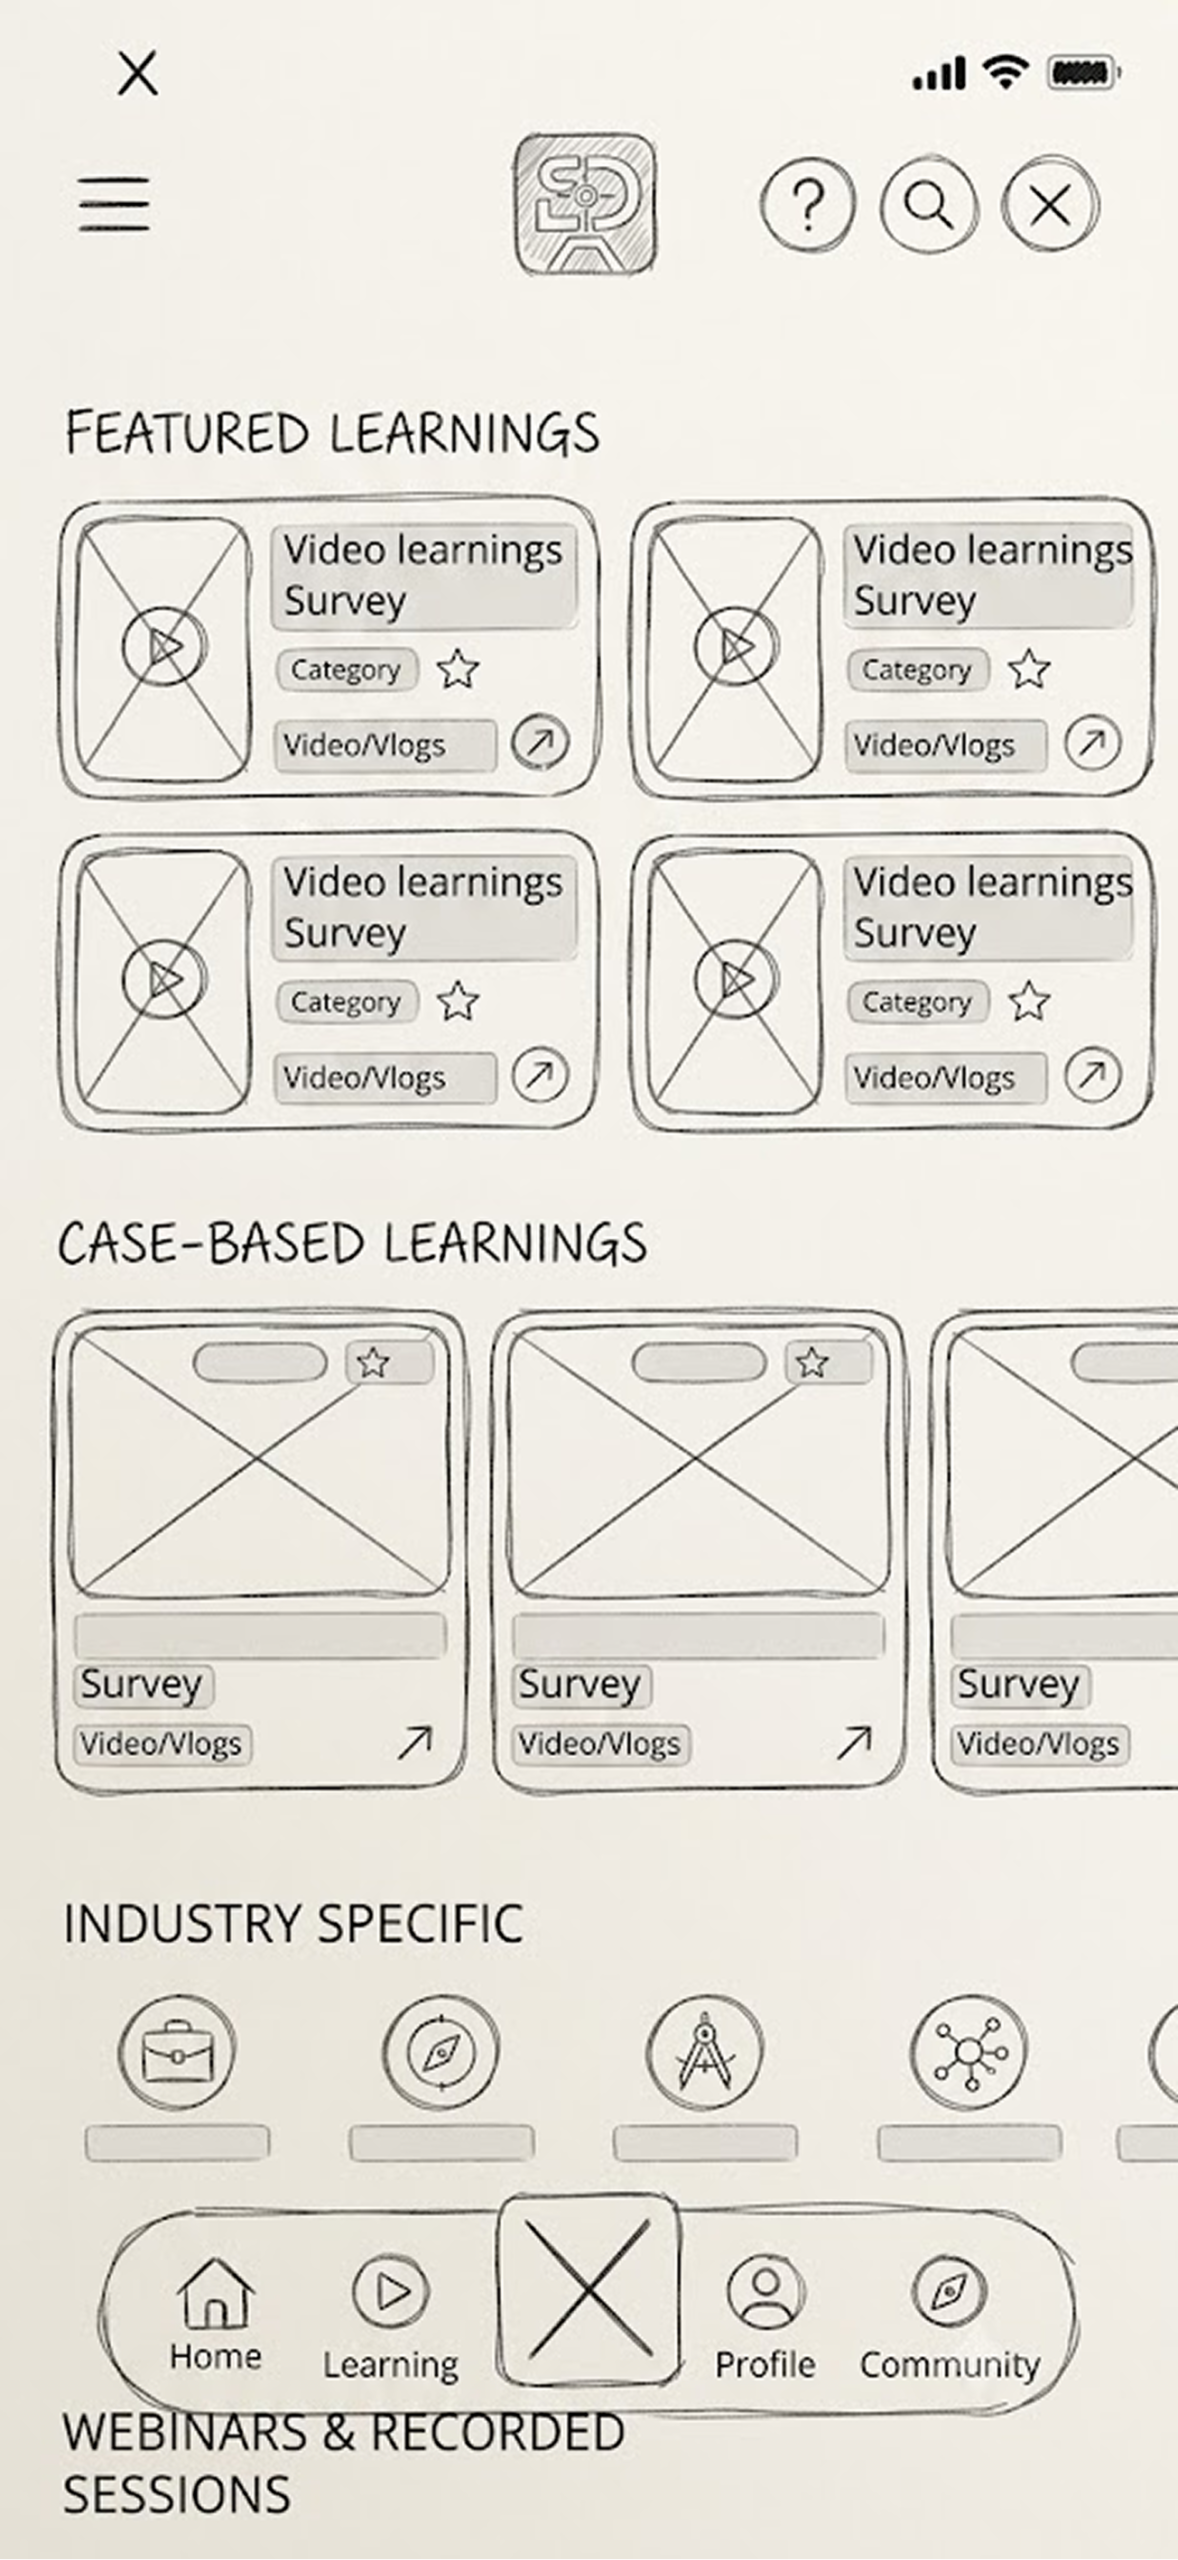
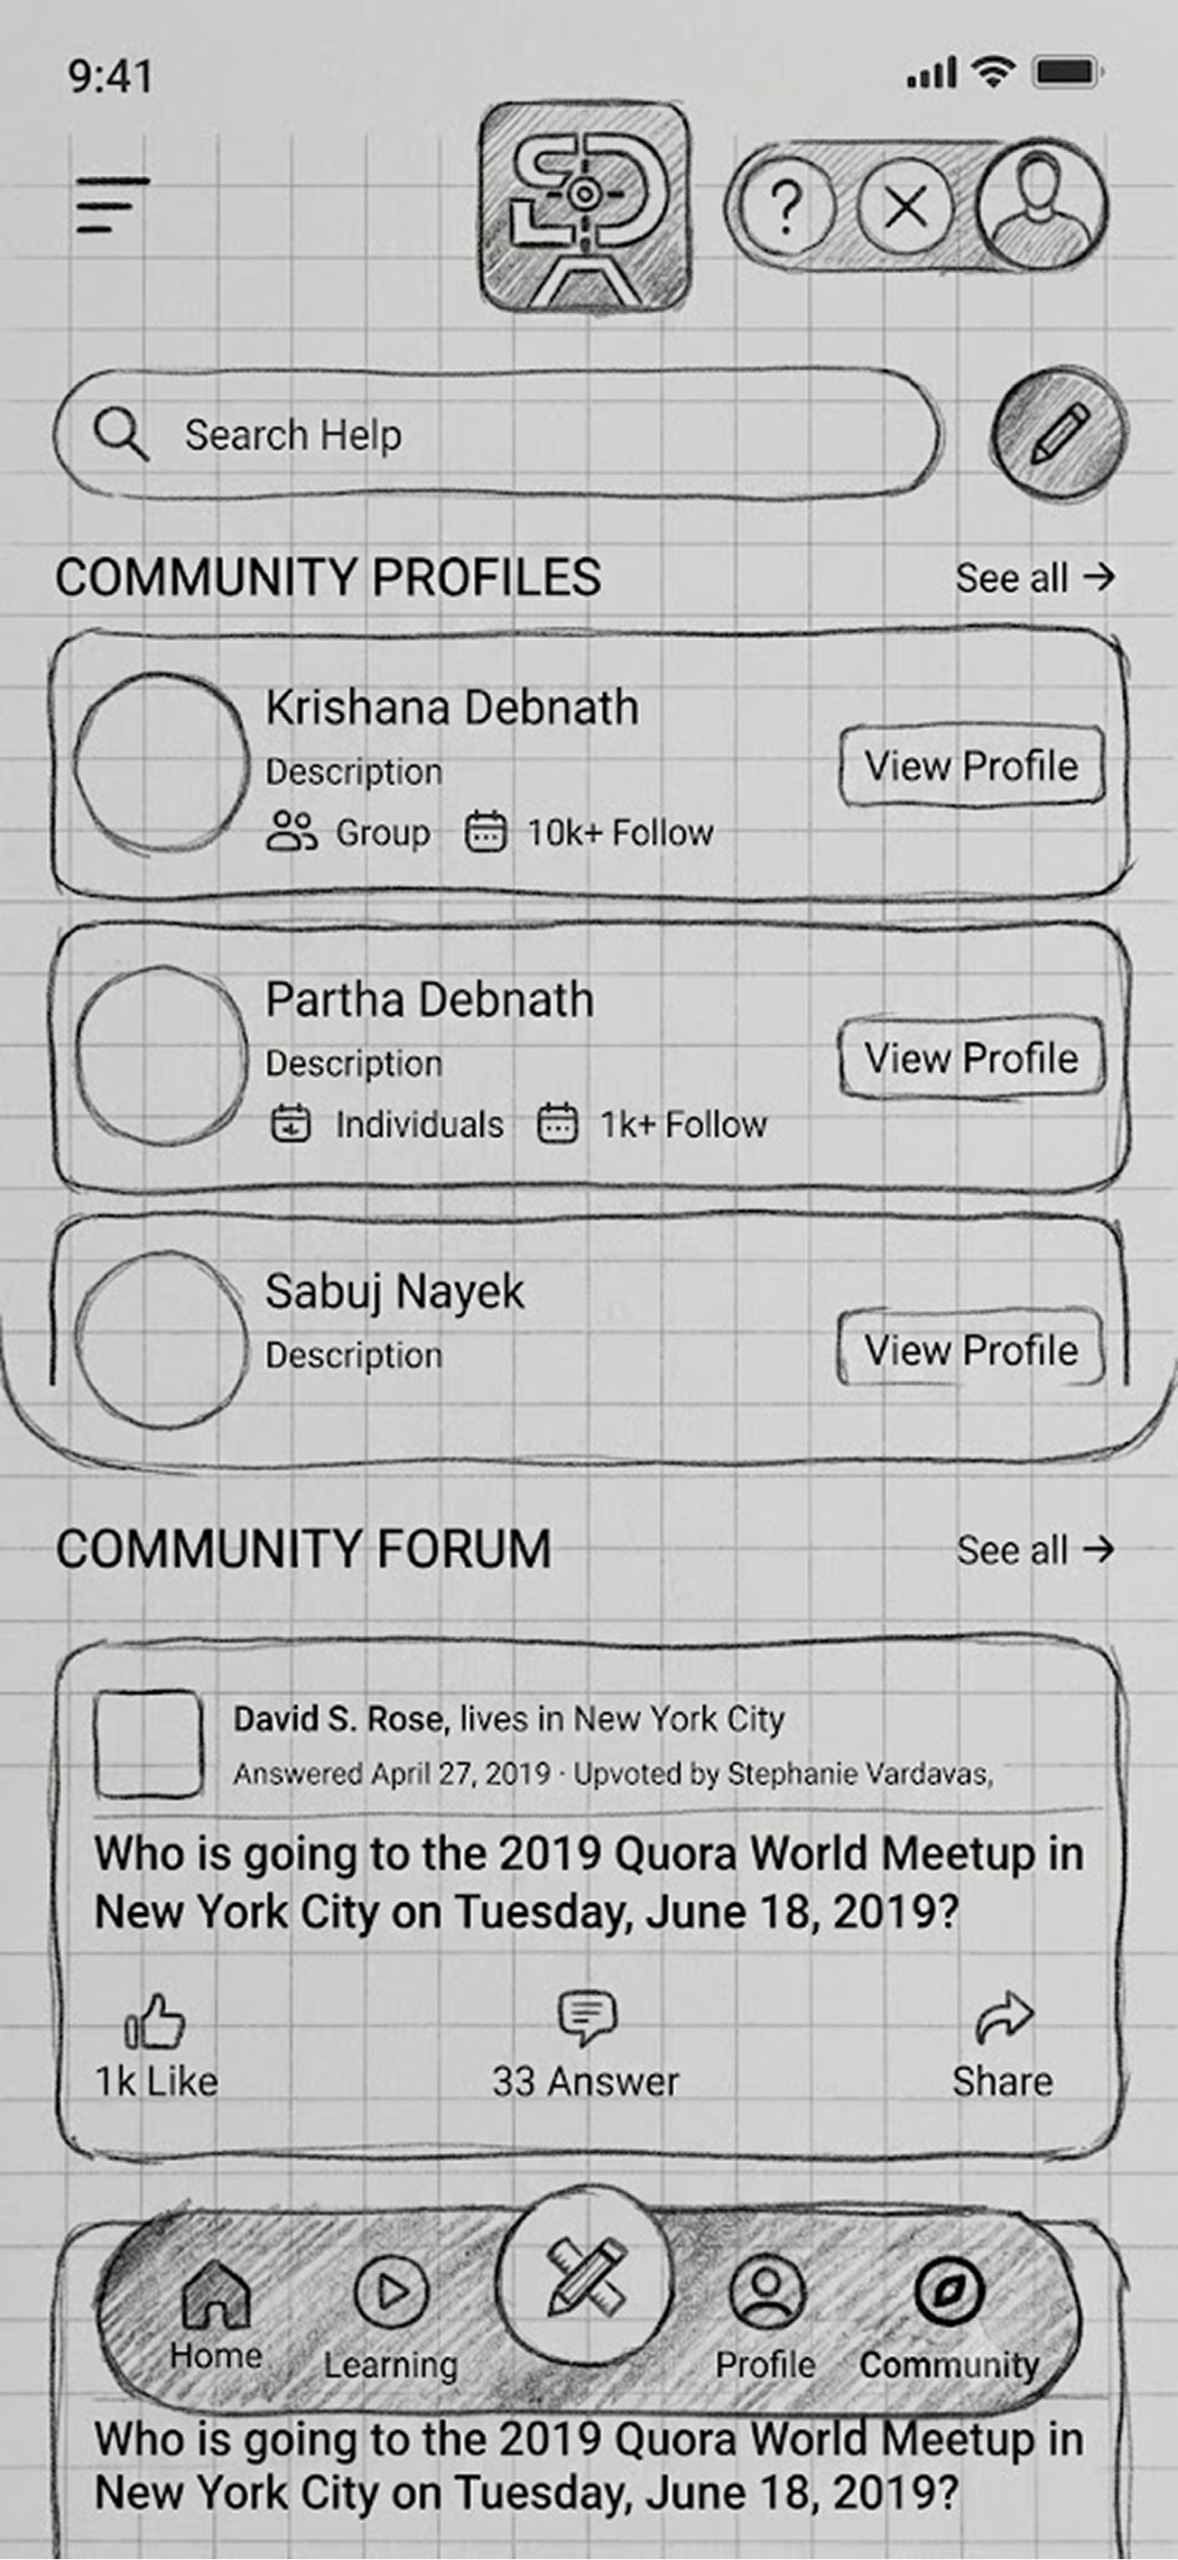
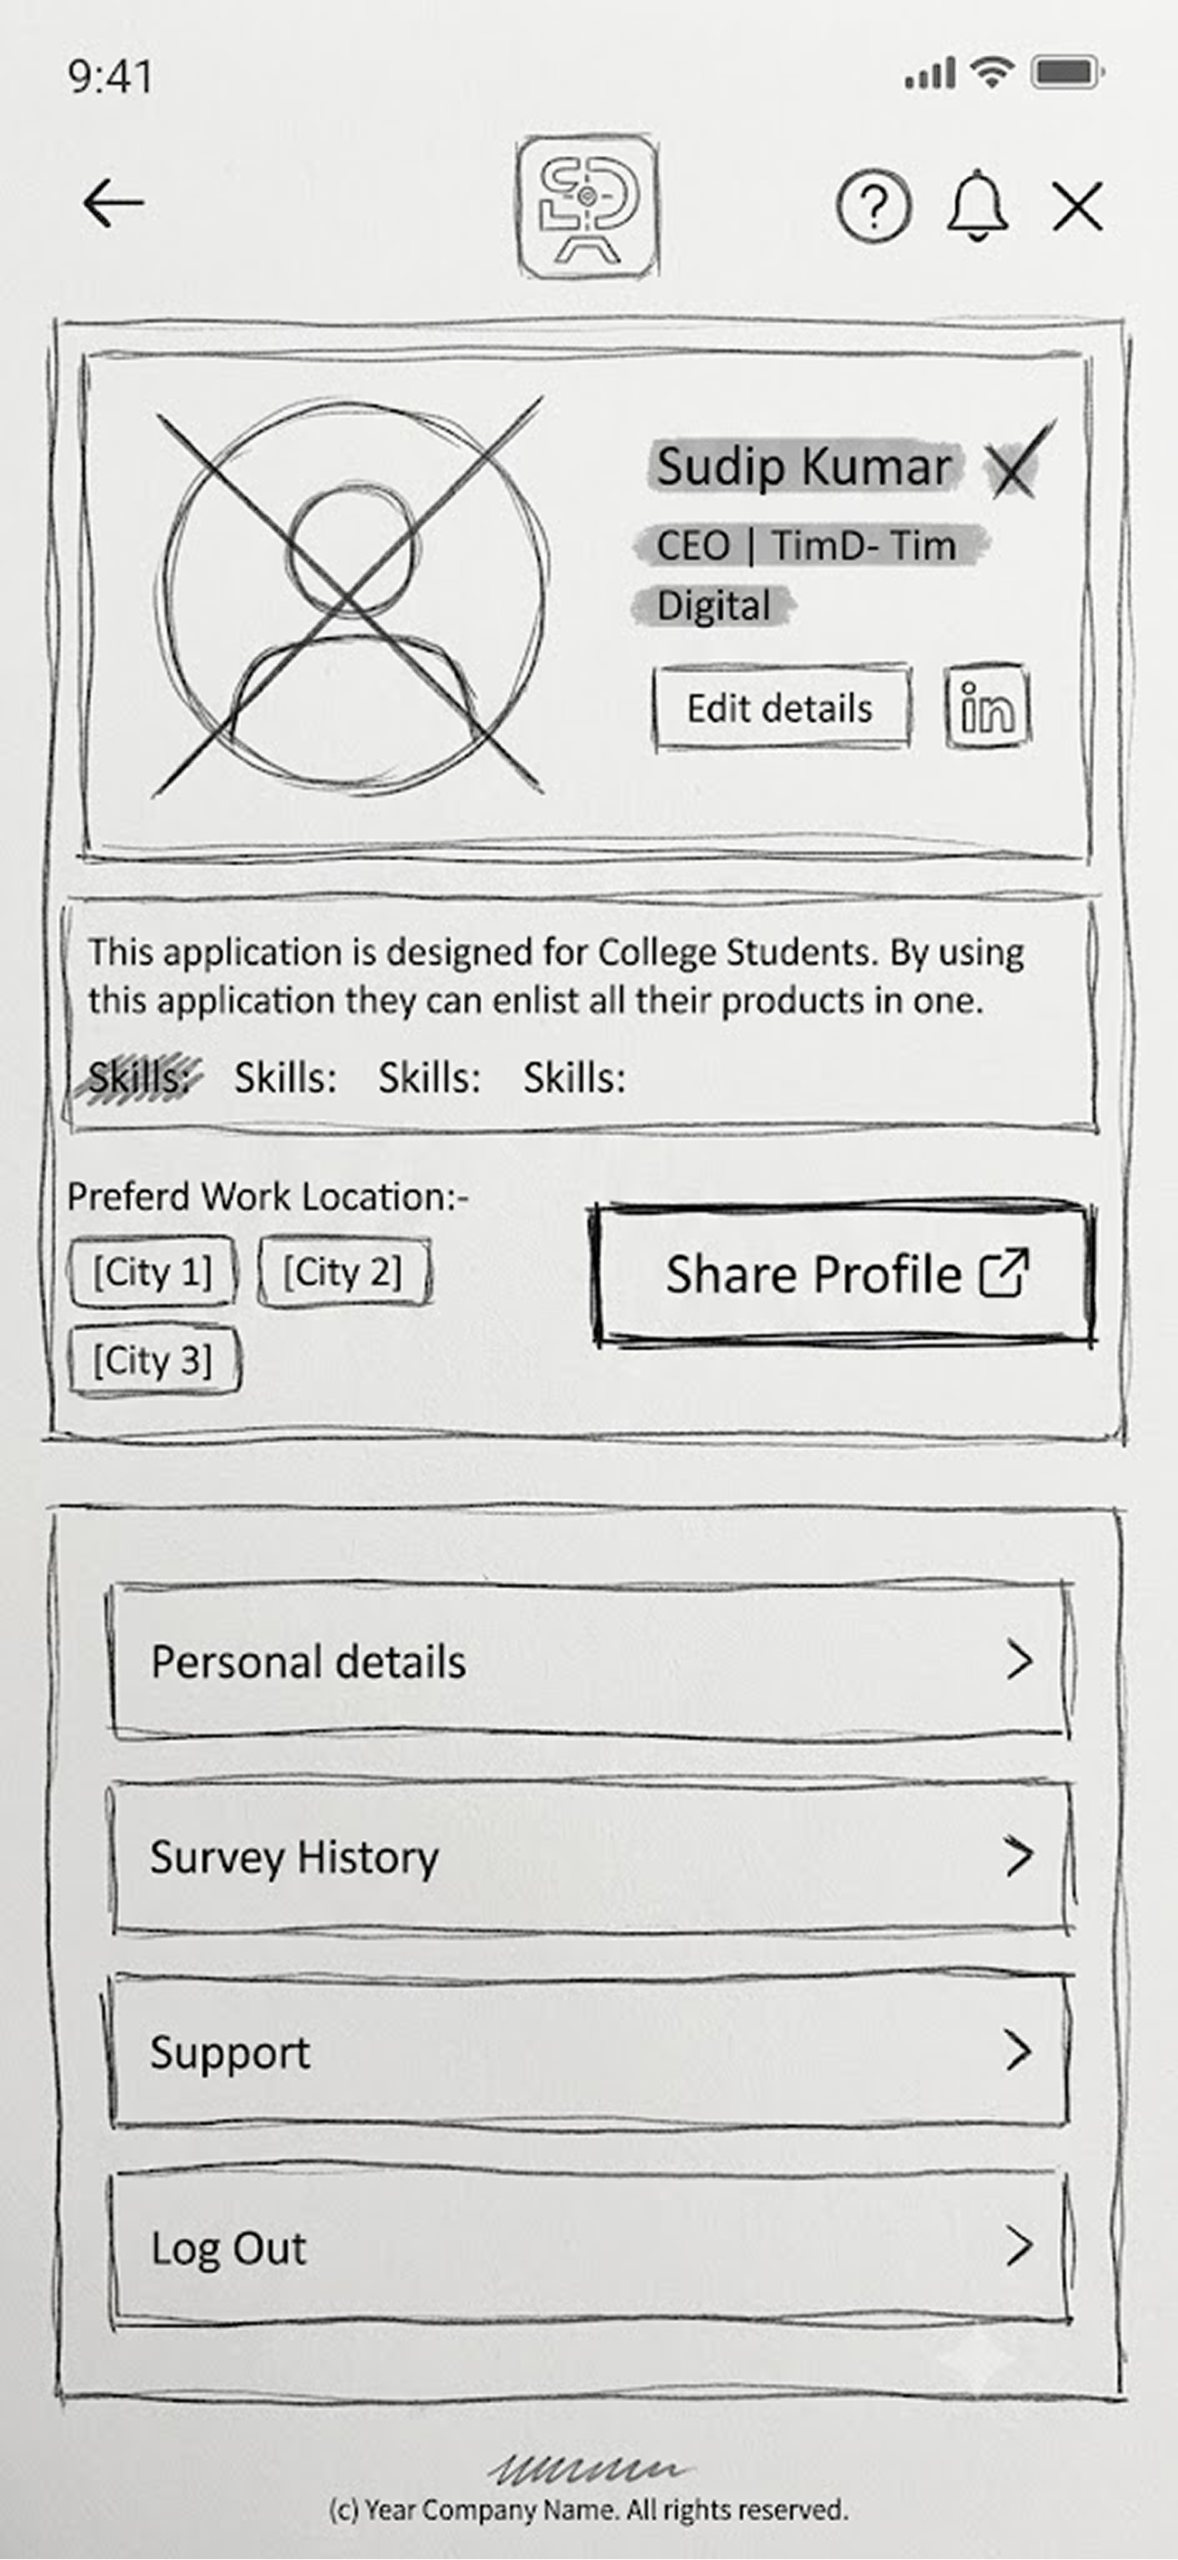
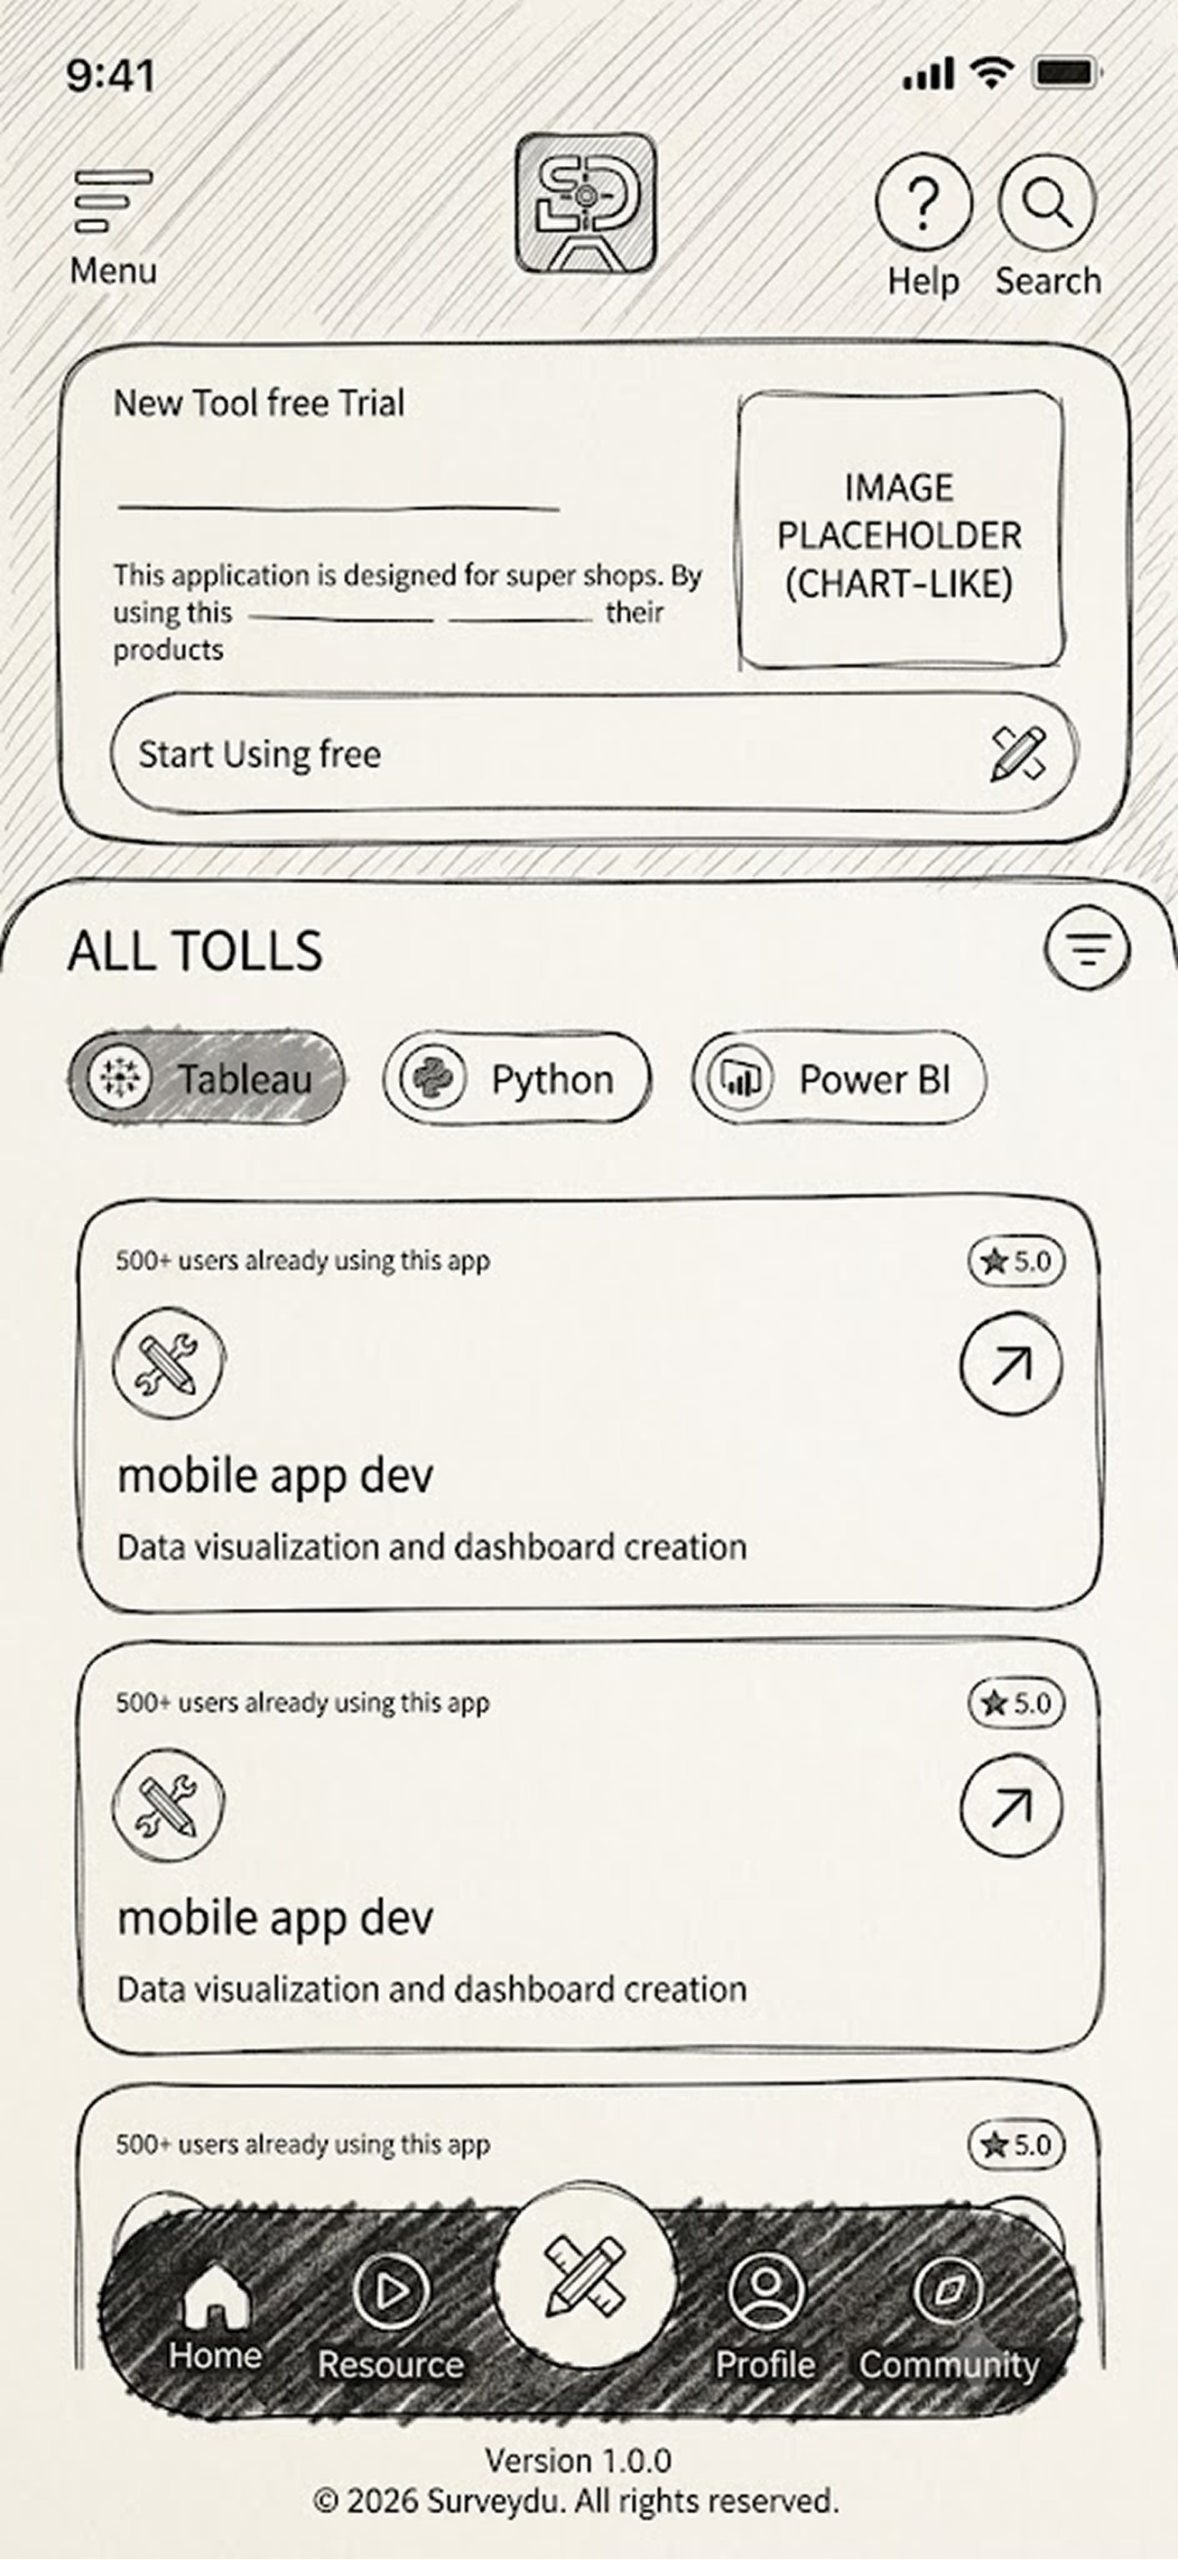
Low Fidelity
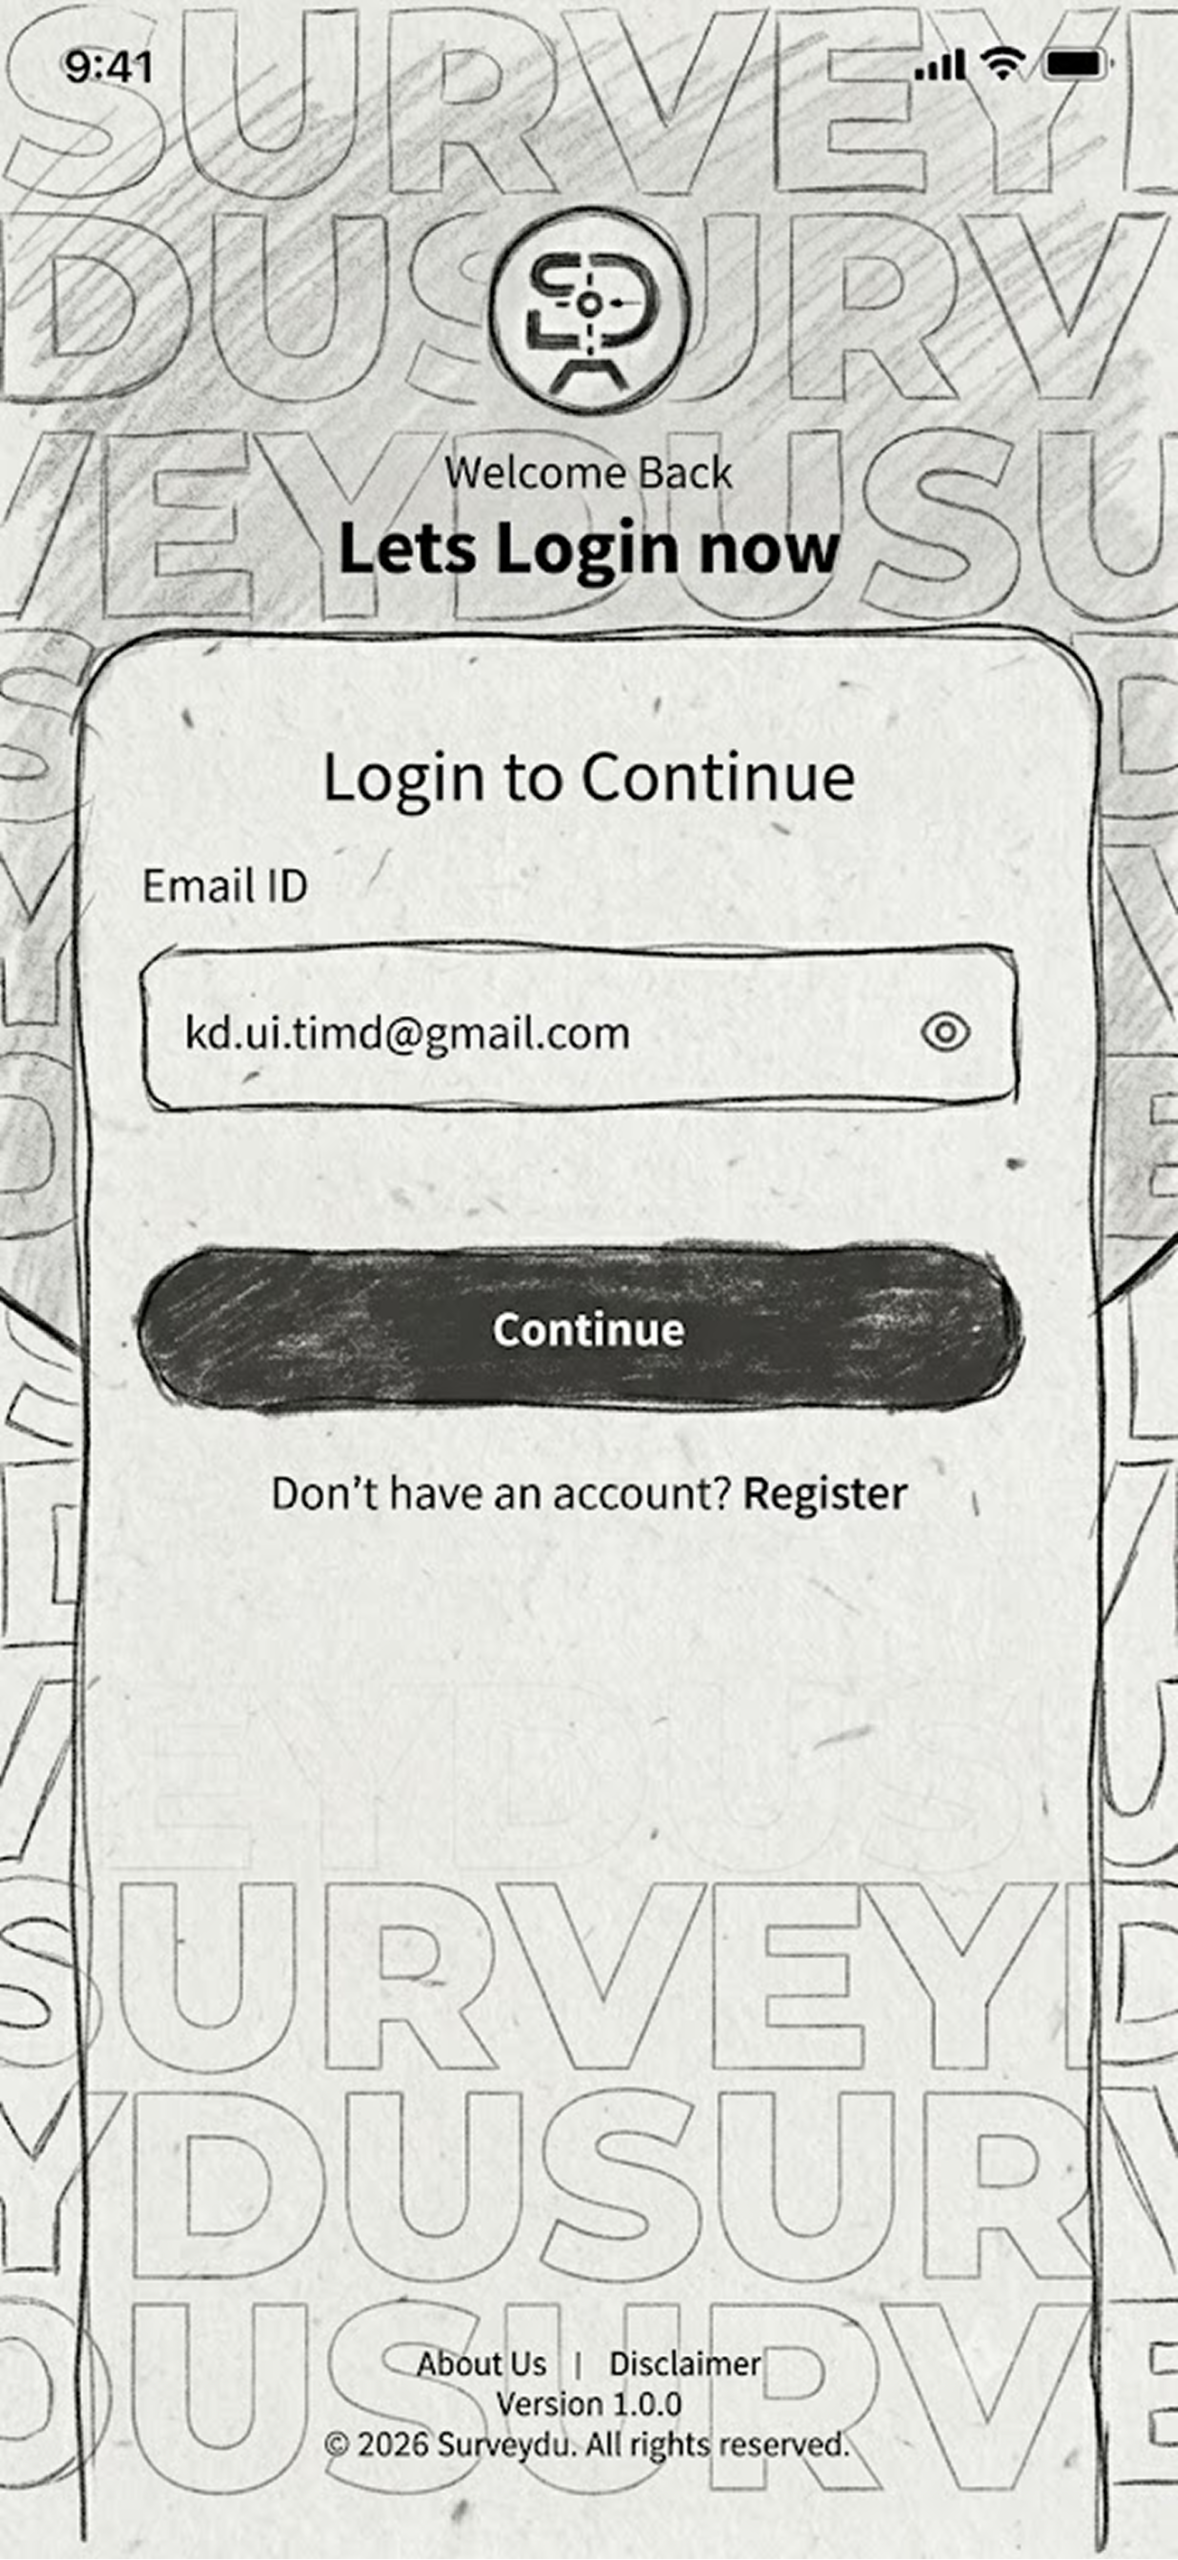
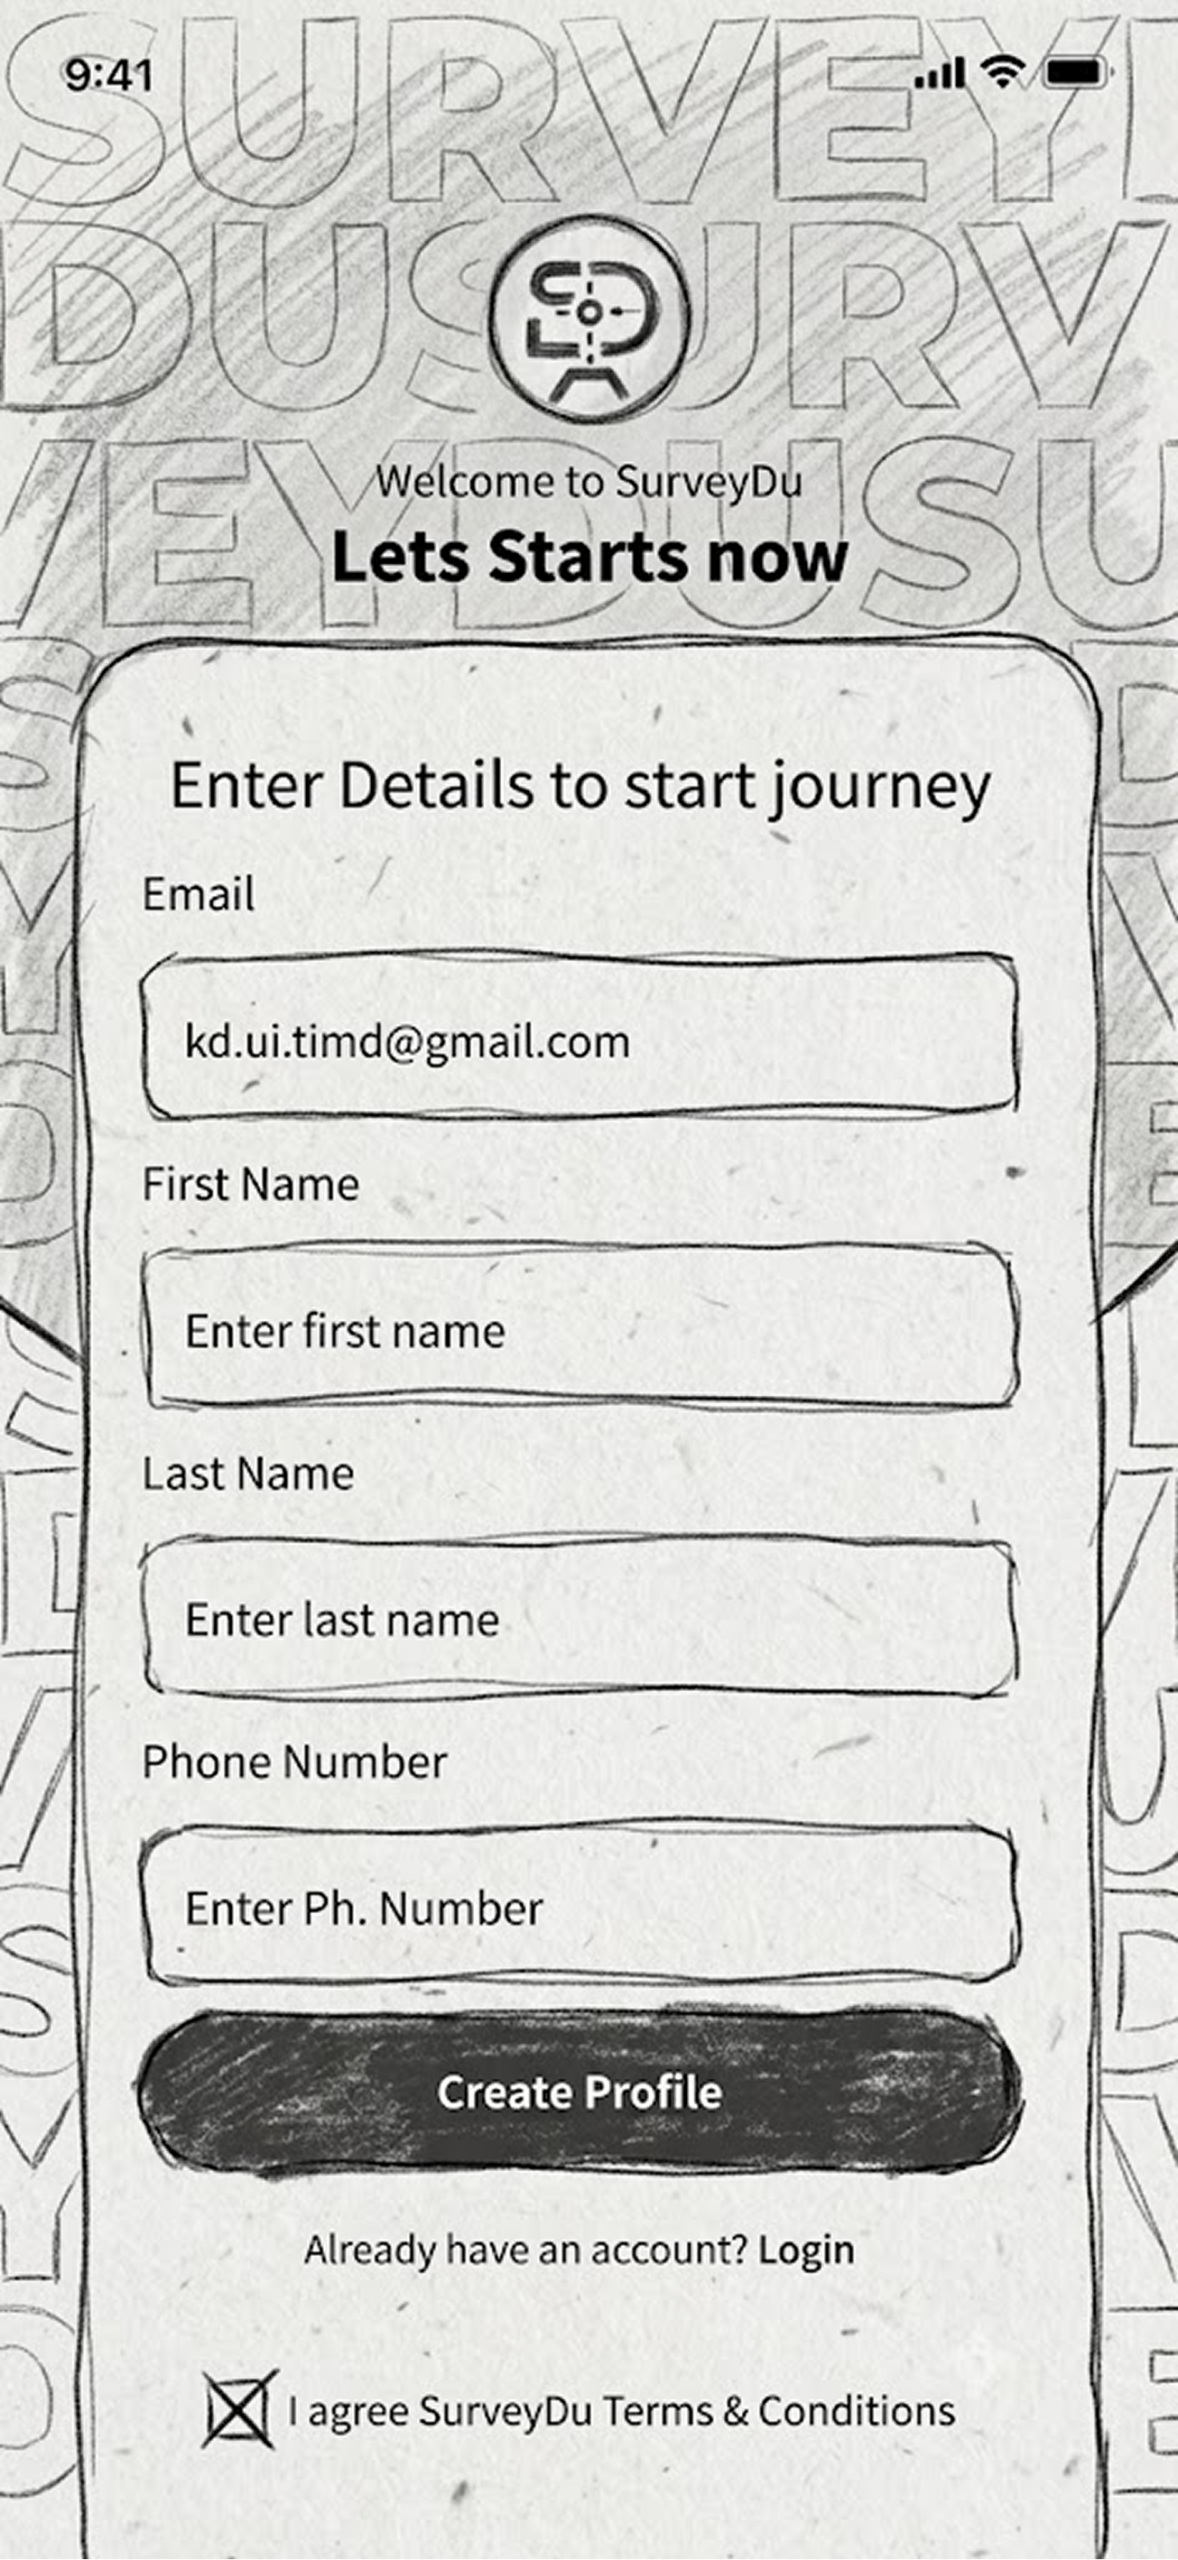
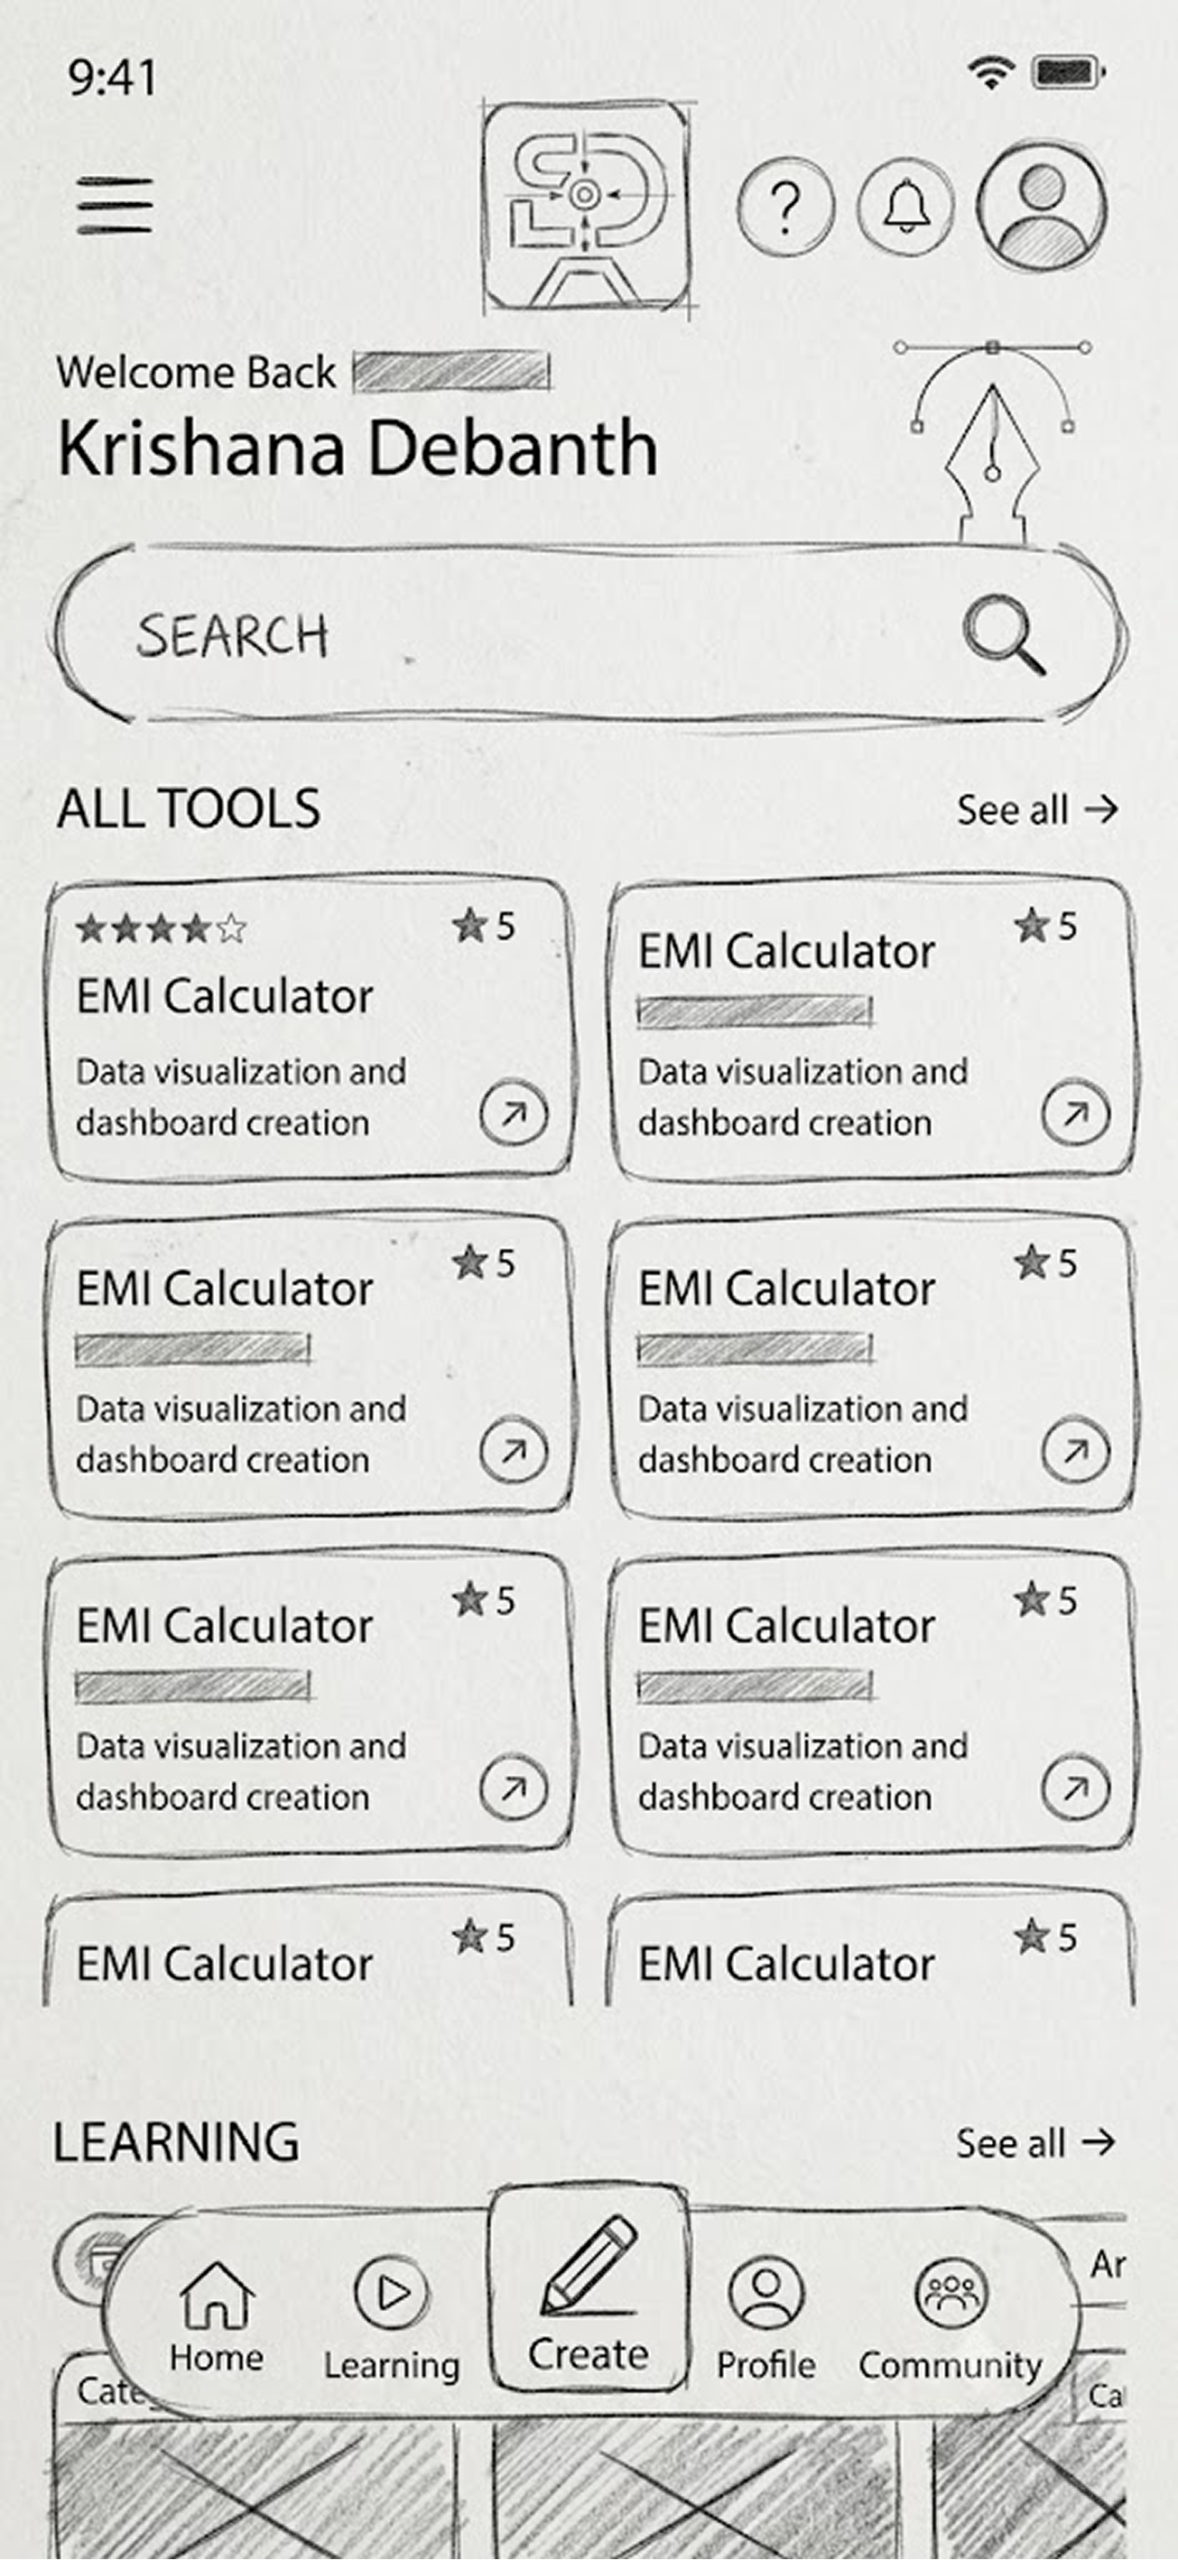
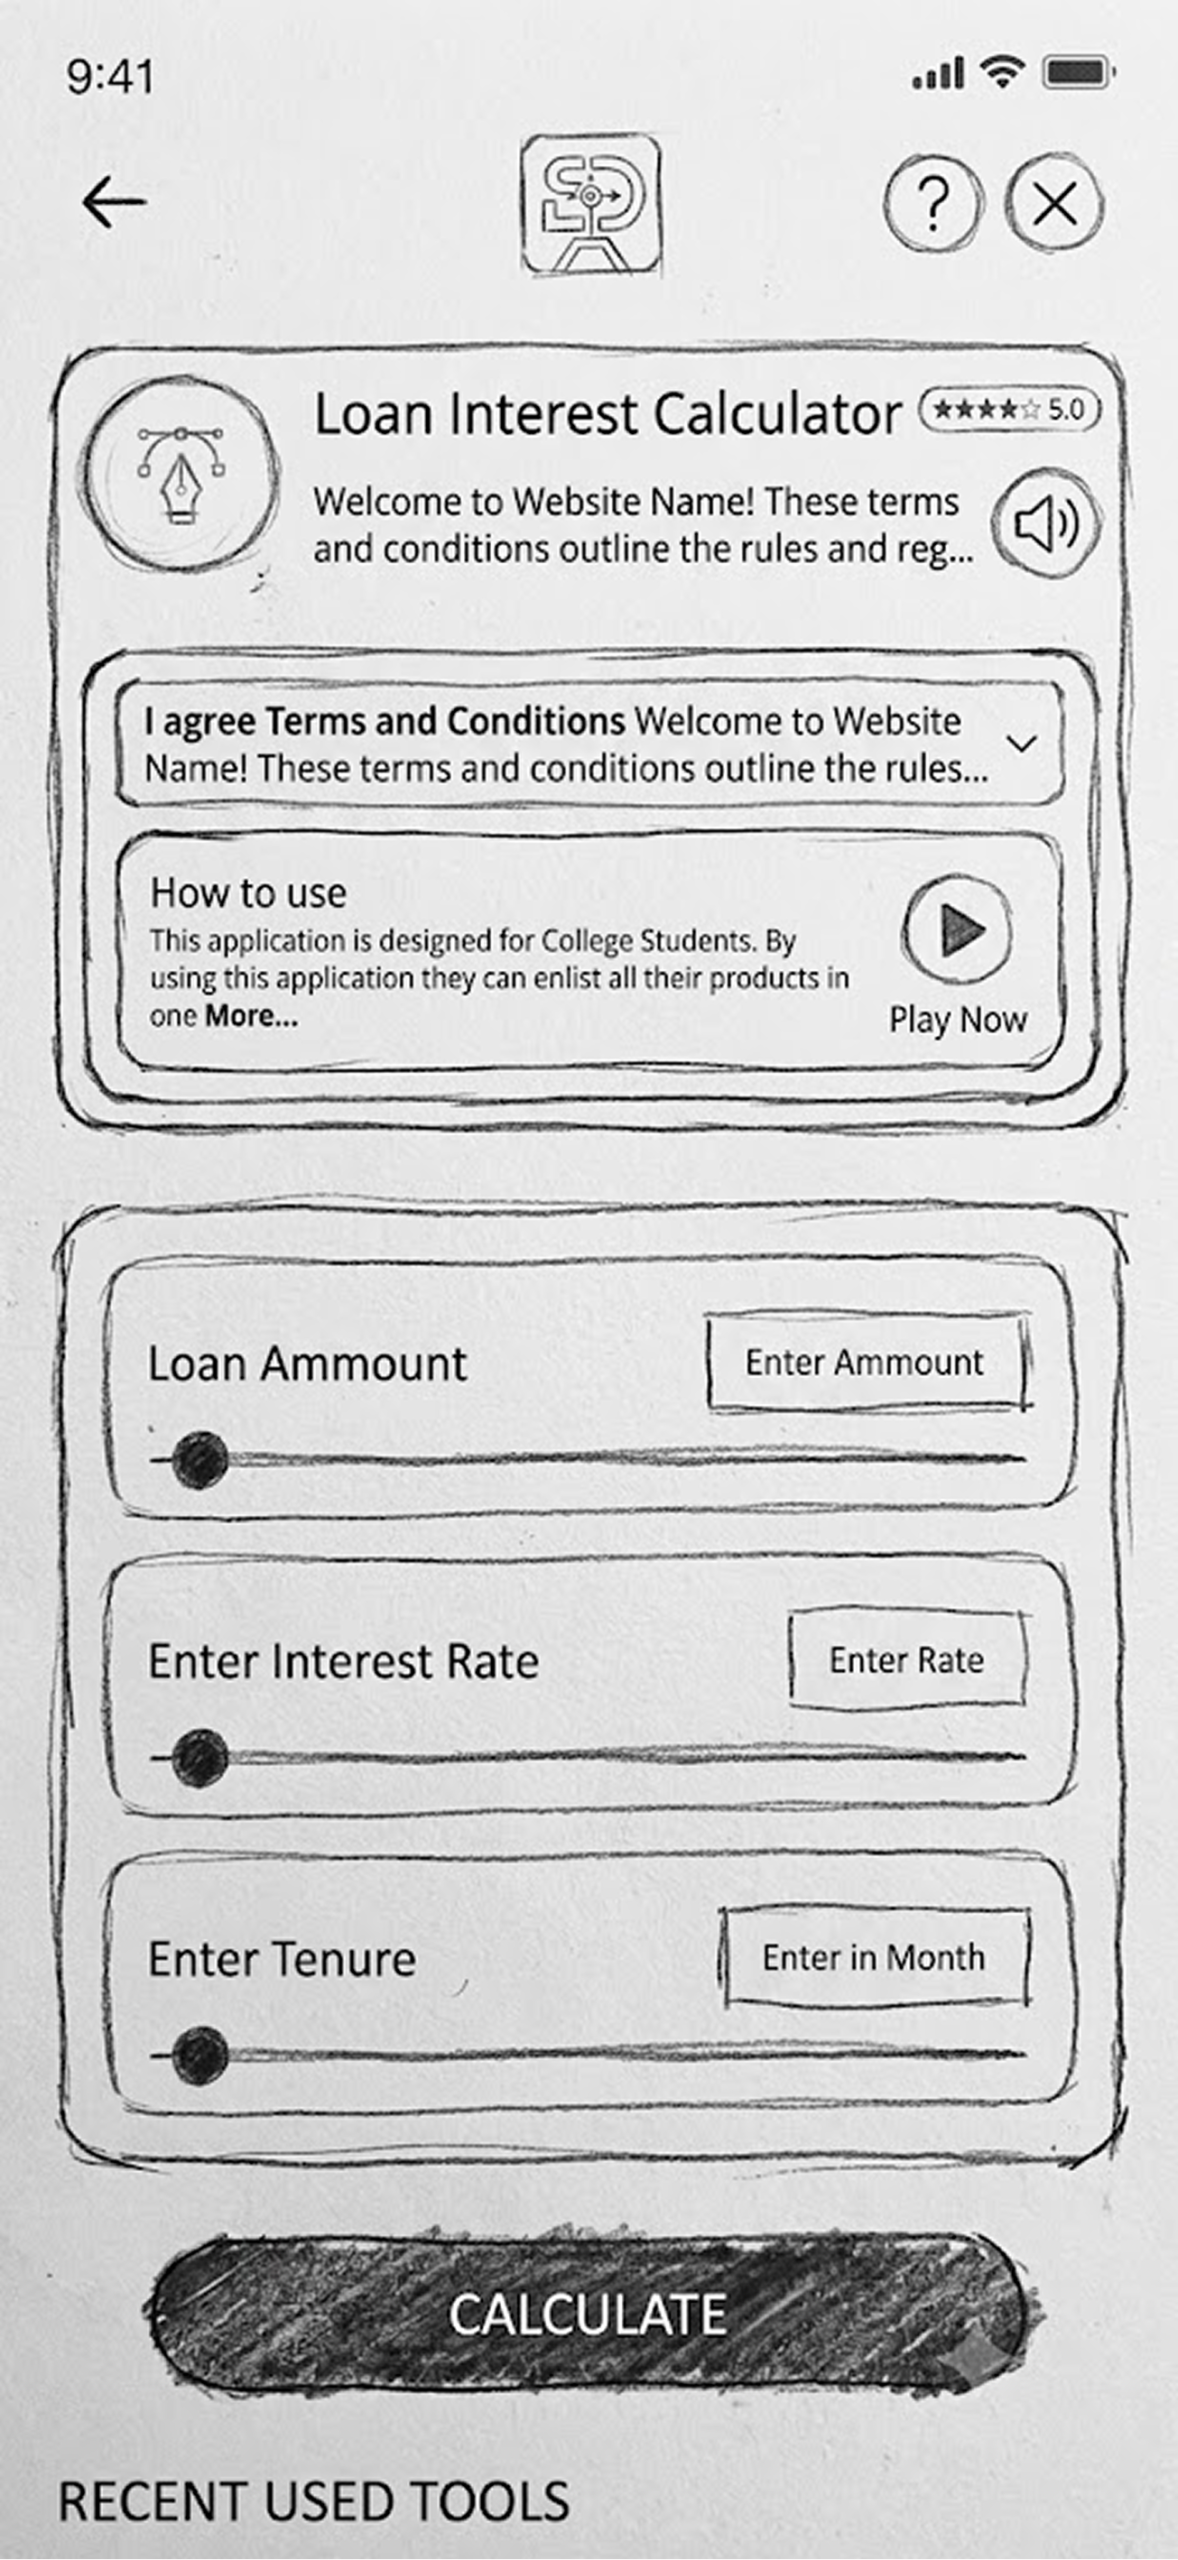
Mid Fidelity
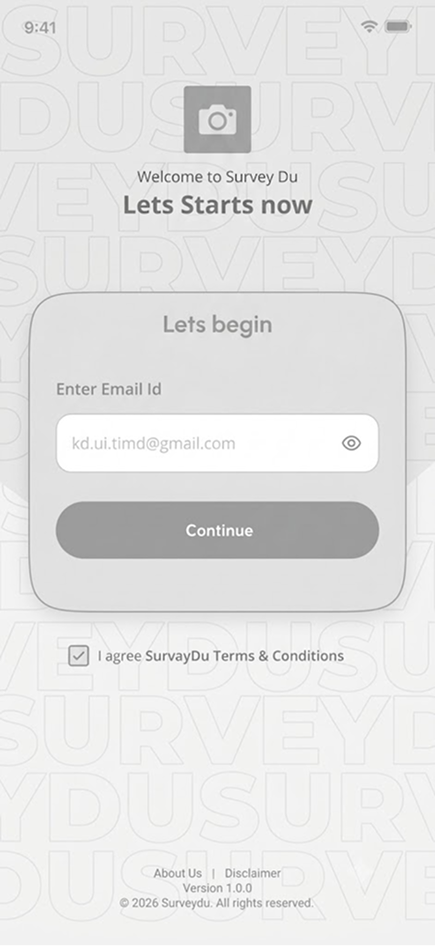
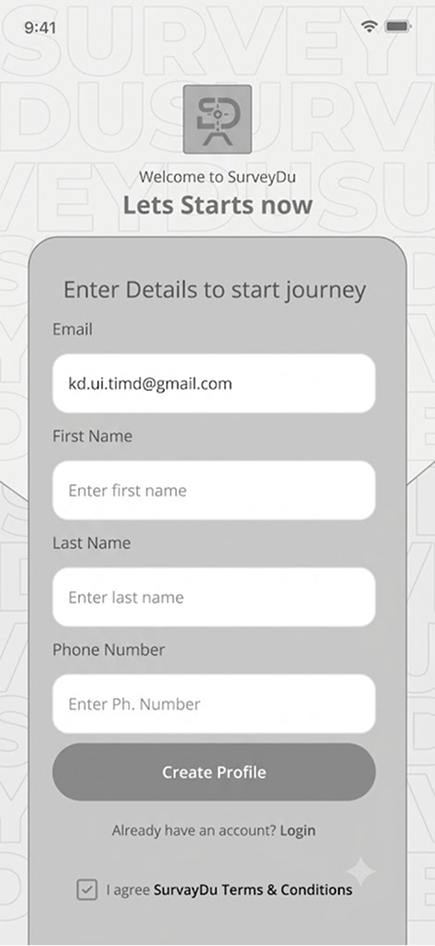
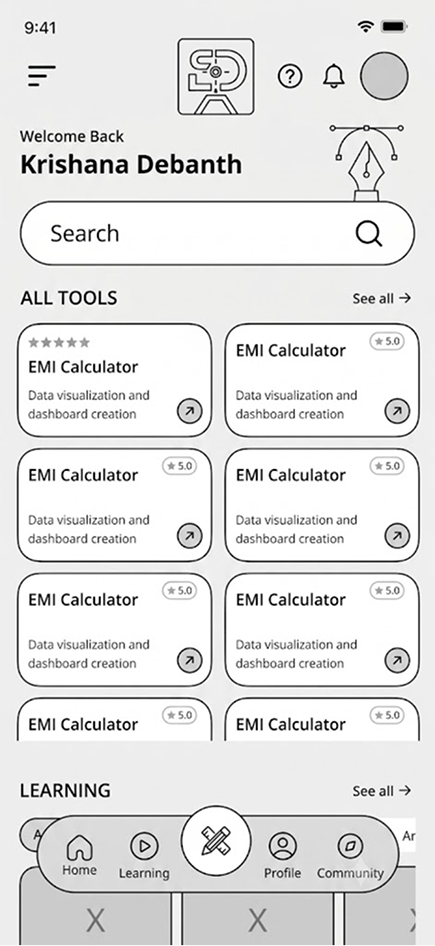
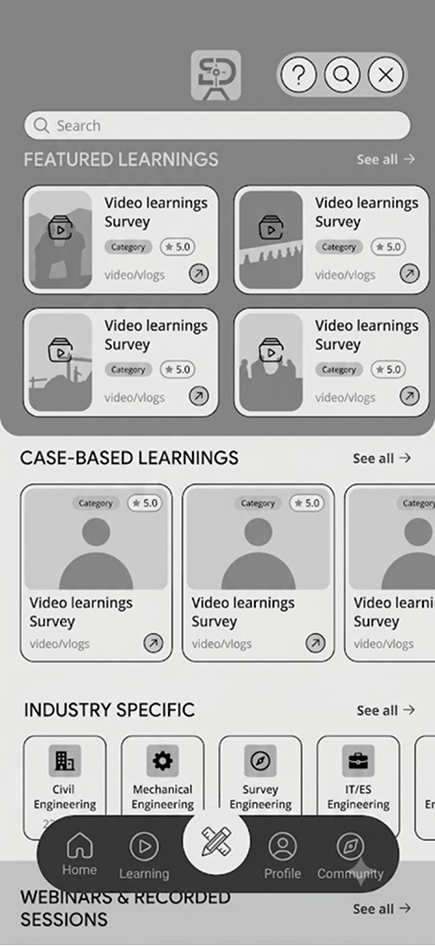
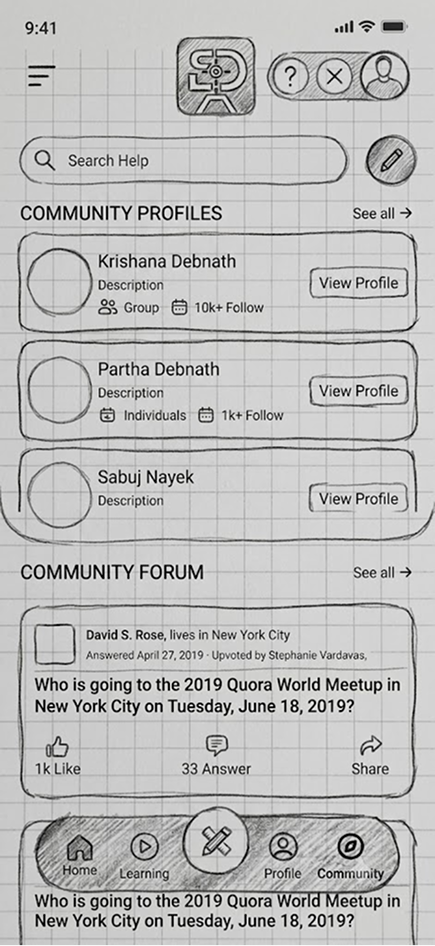
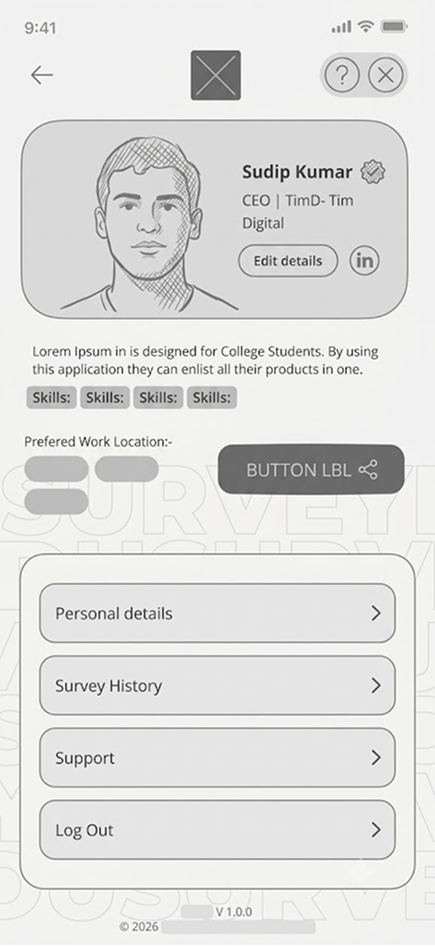
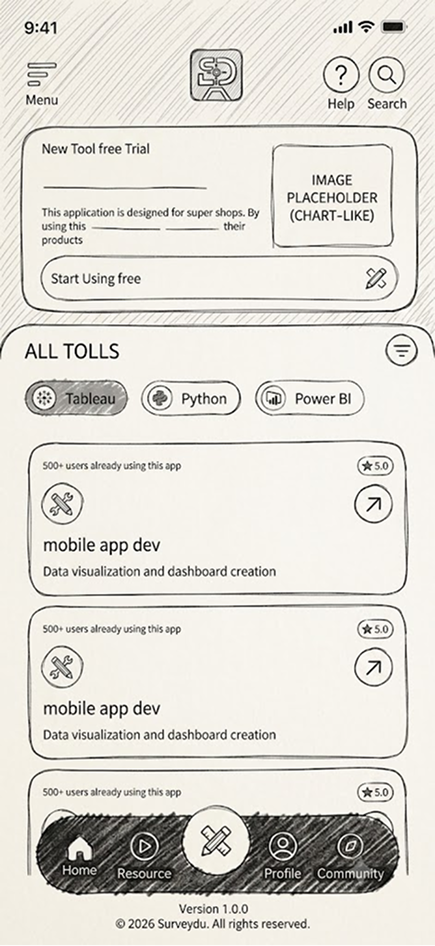
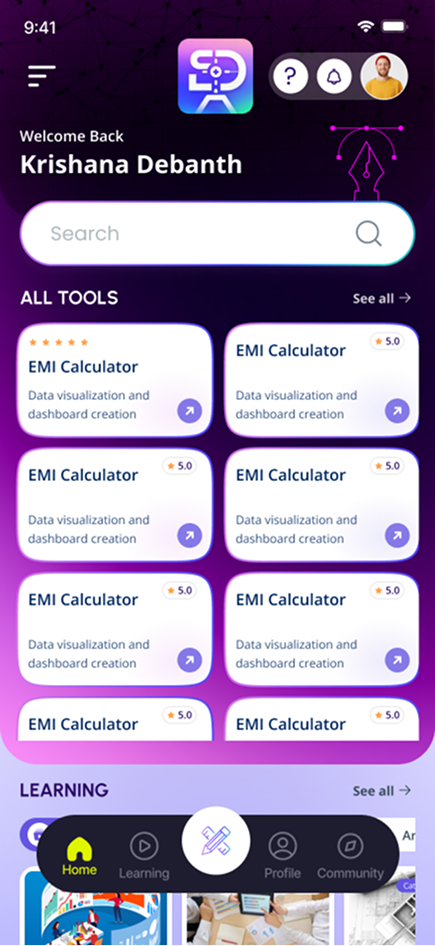
High Fidelity
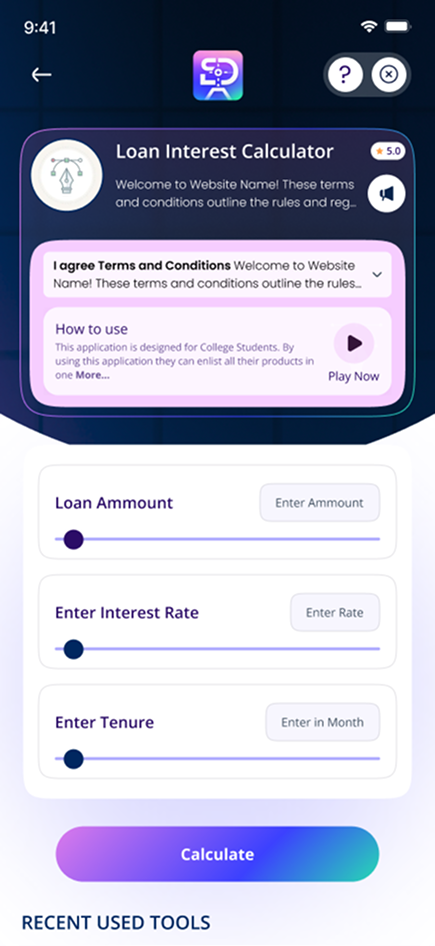
Design System & UI Kit
Visual Tokens
SurveyDu adopts a clean and approachable design language built around soft gradients, spacious layouts, rounded components, and accessible color contrast. The visual system emphasizes clarity and readability while supporting long-form interactions without creating cognitive fatigue.
Typography & Components
- Main Font Urbanist
Final Visual Design
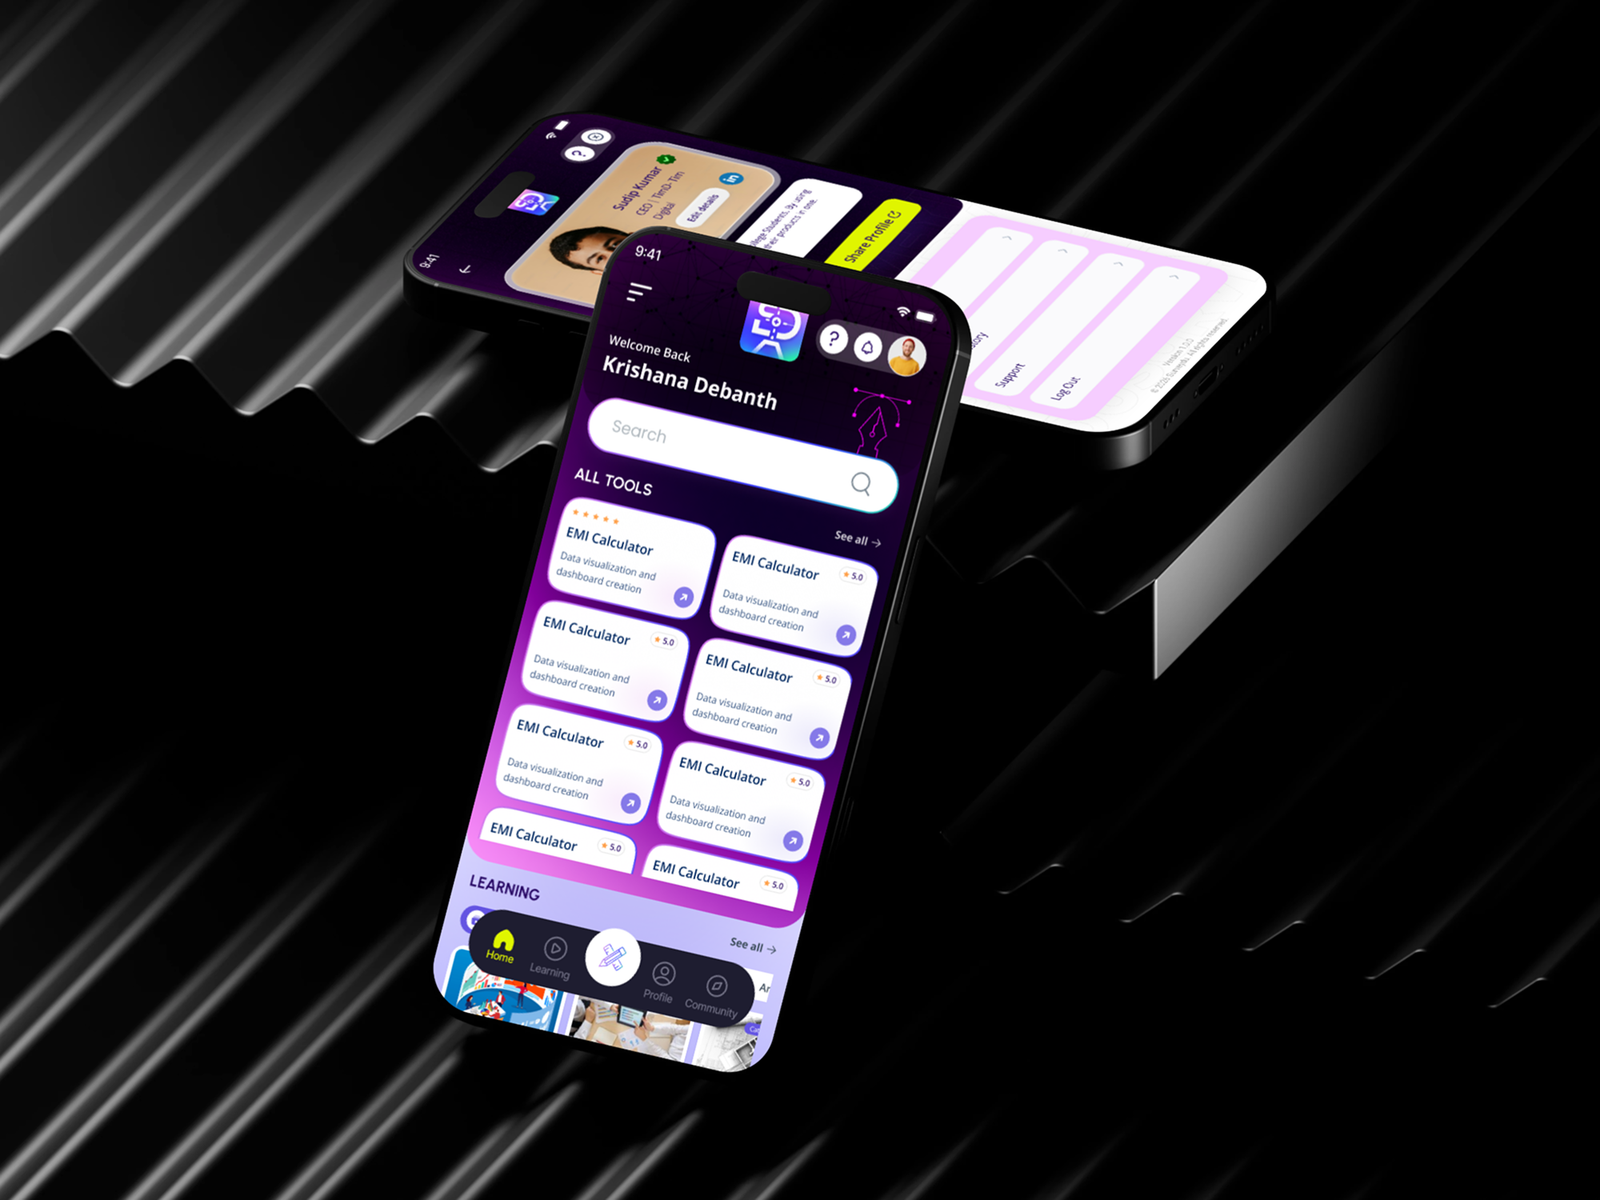
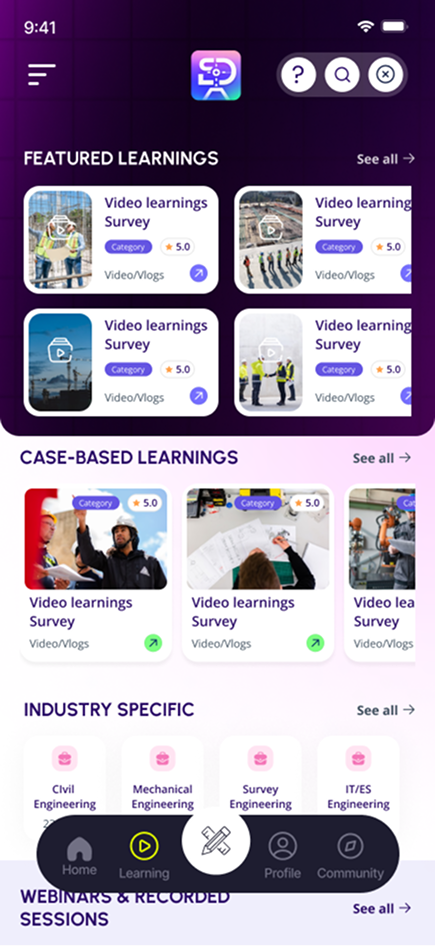
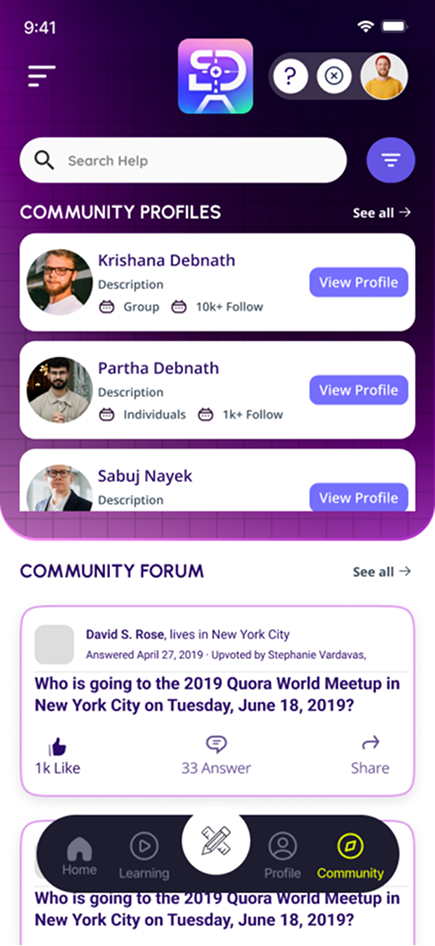
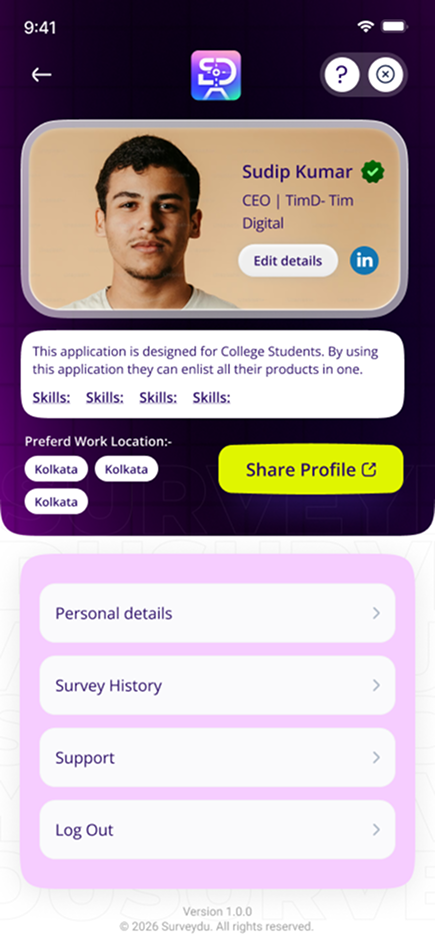
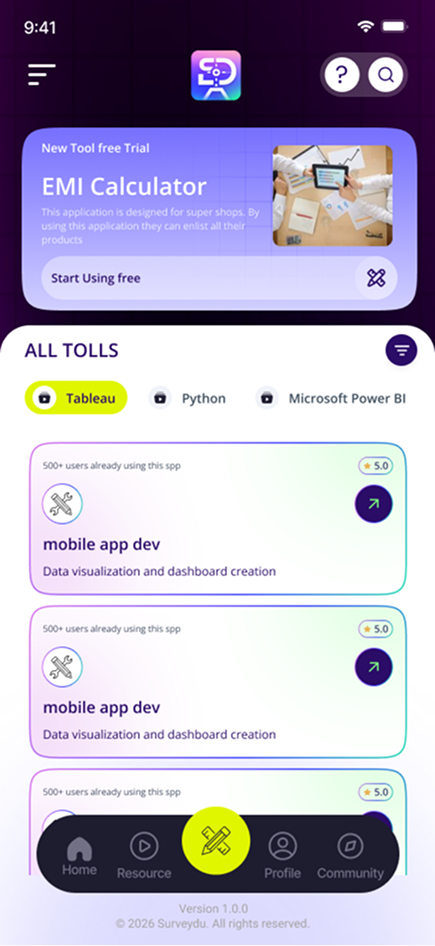
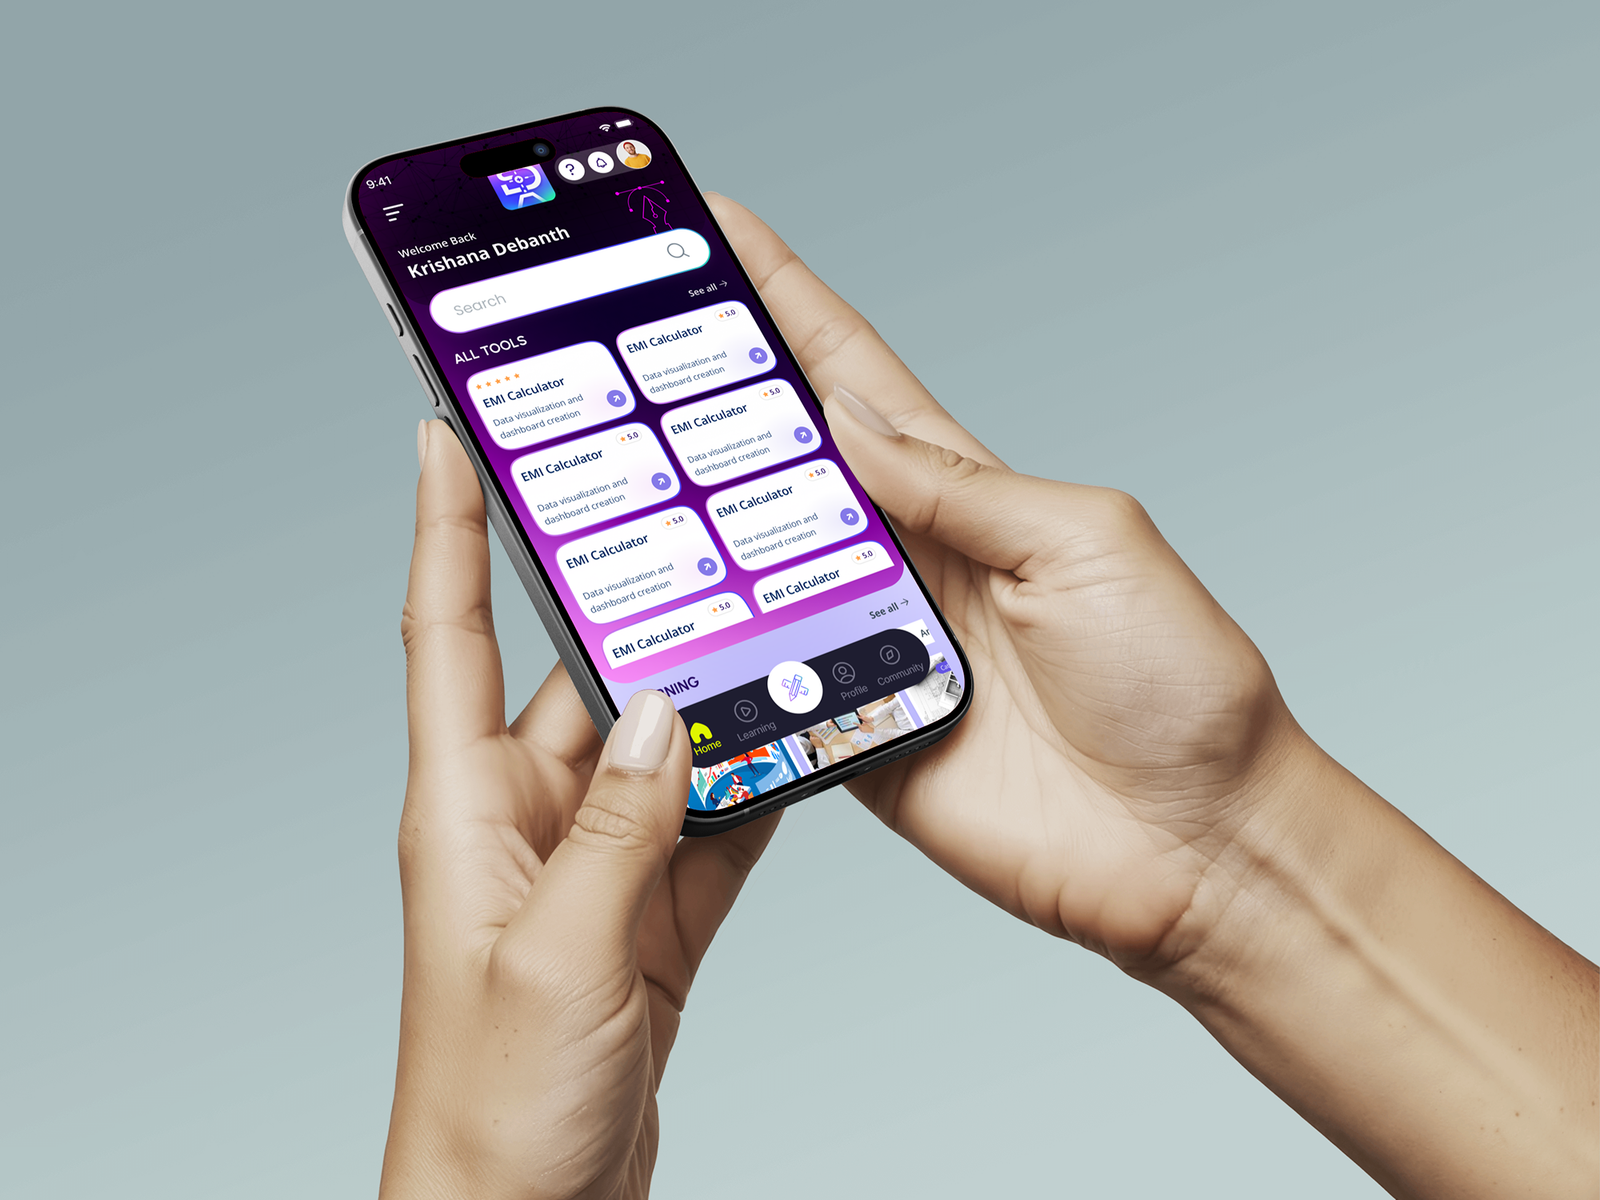 A cohesive mobile-first interface combining intuitive survey experiences, modern visual aesthetics, and scalable design components for both respondents and administrators.
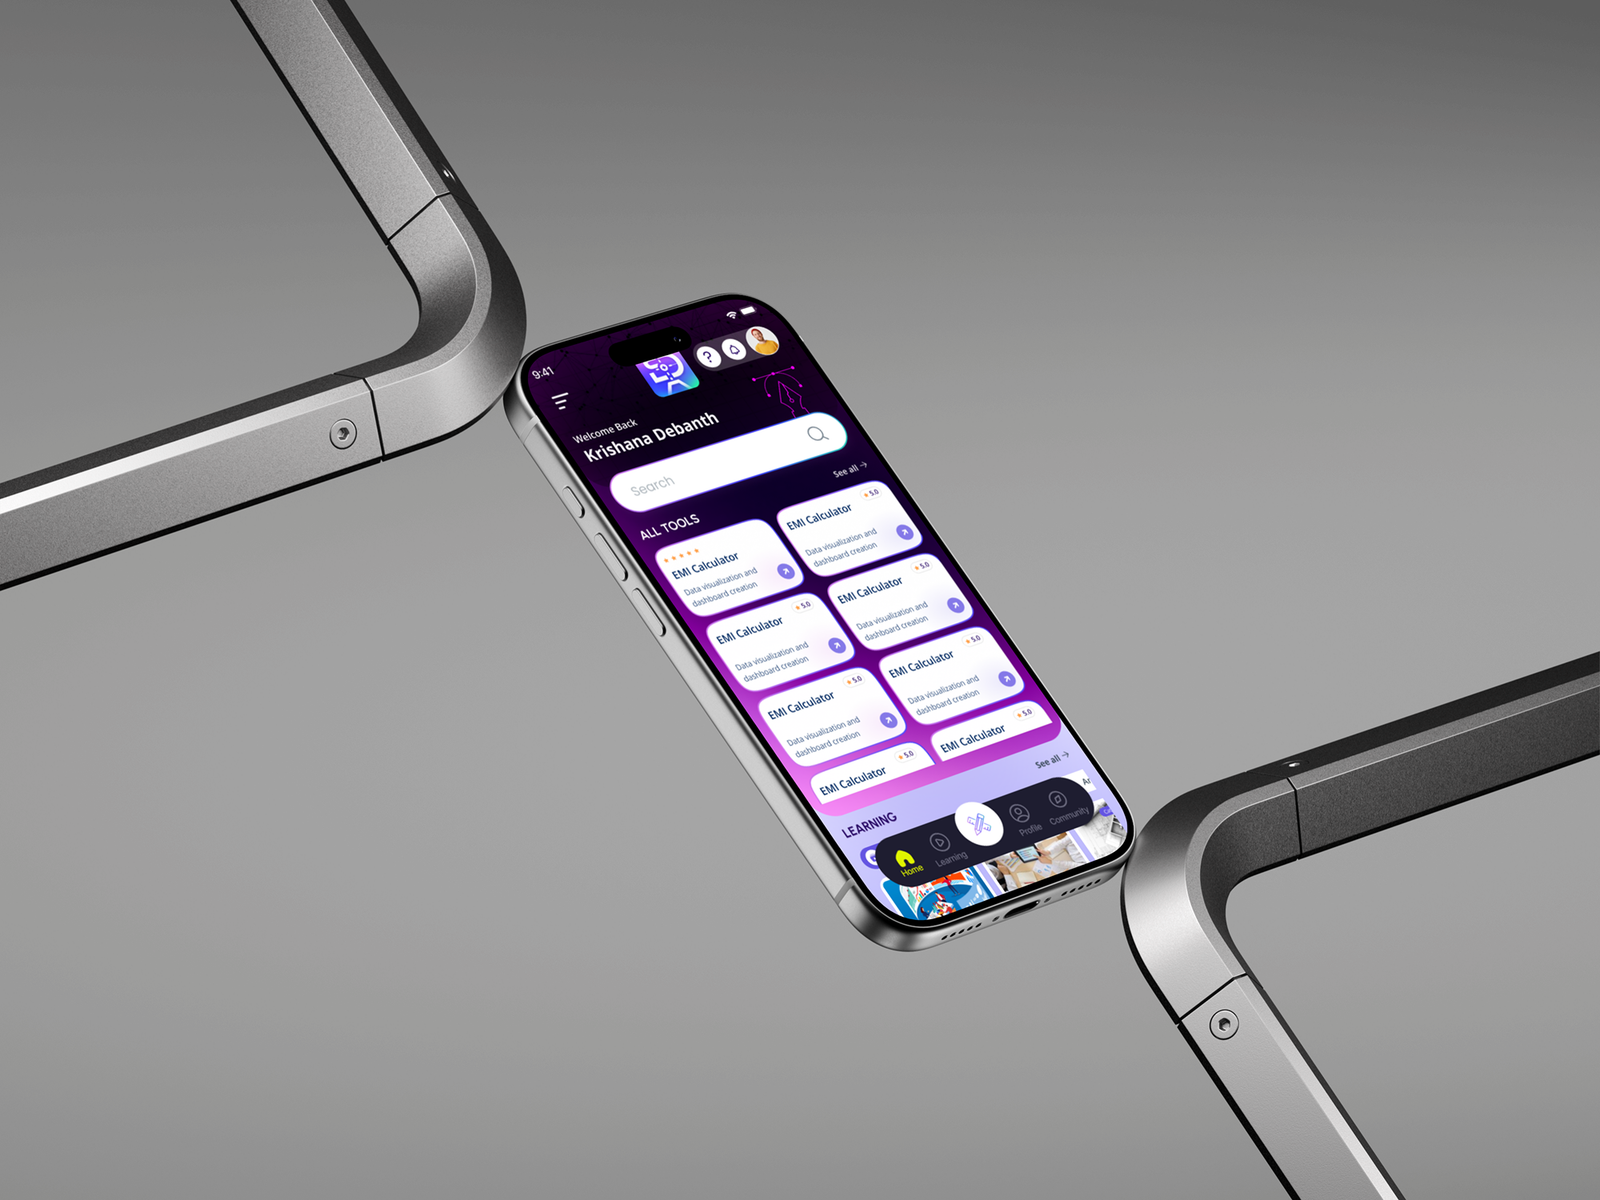
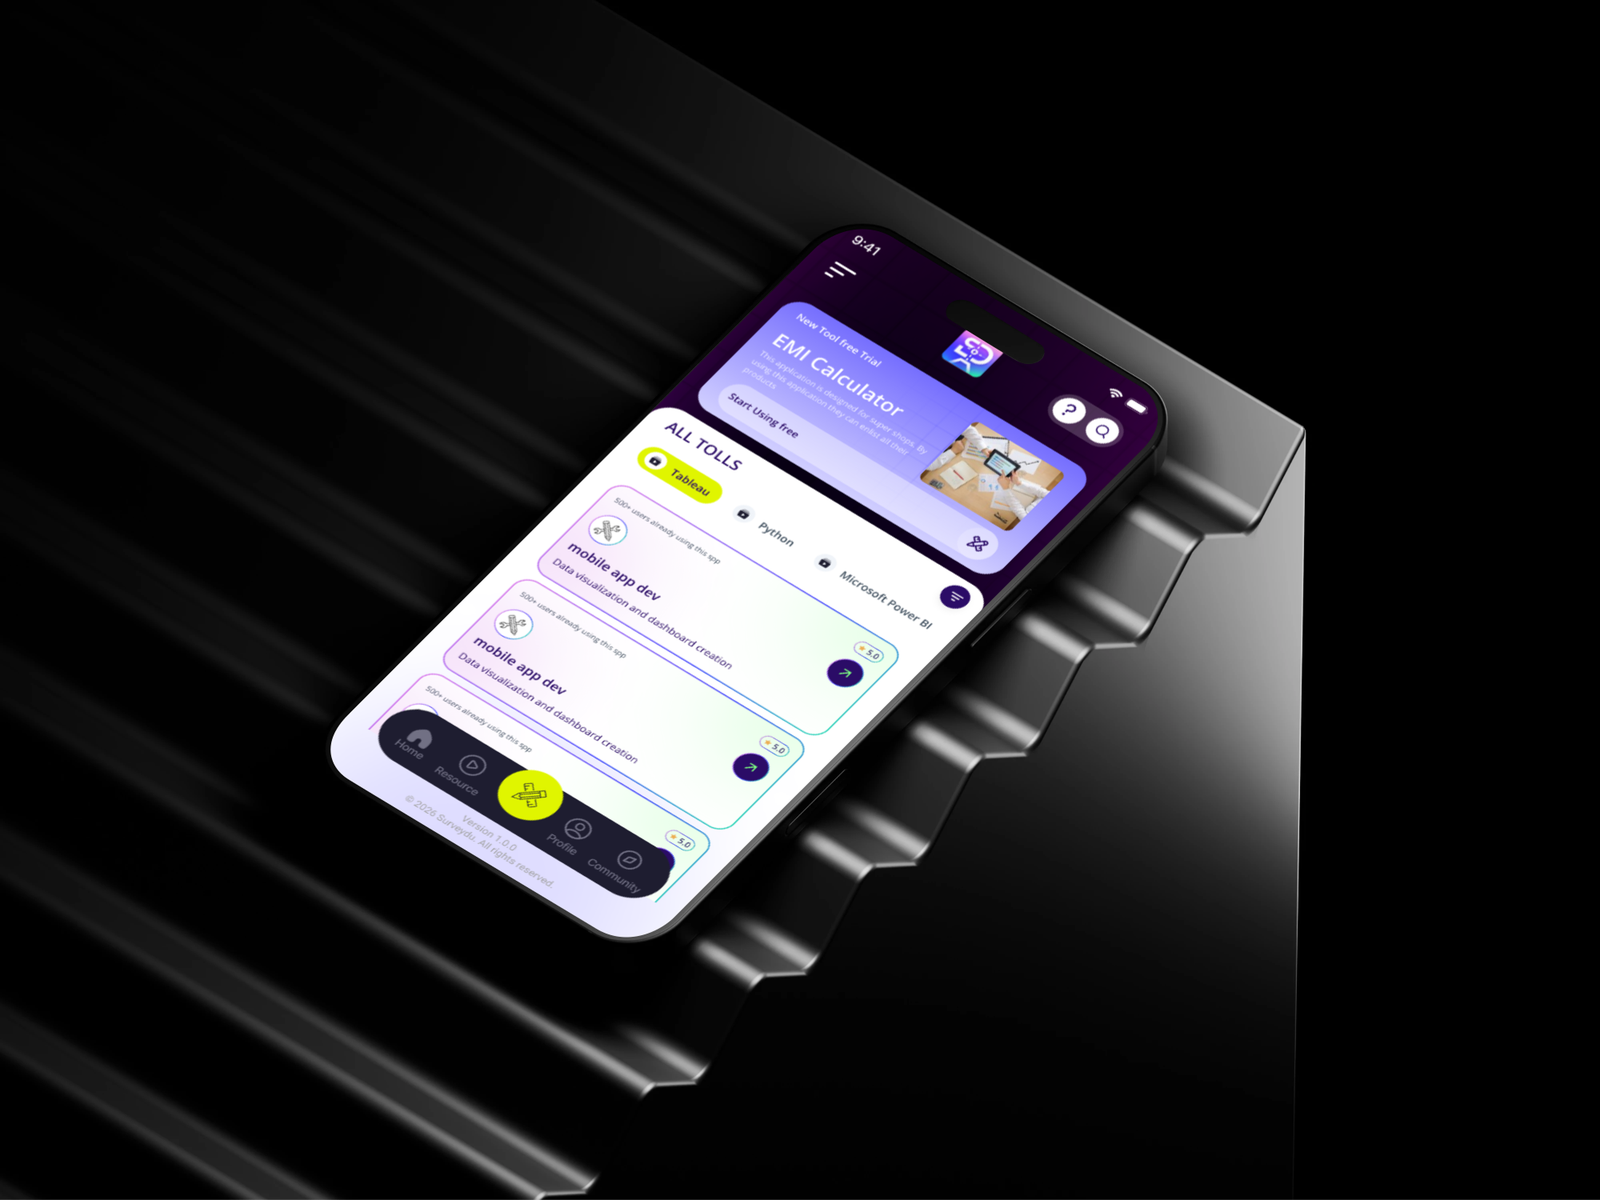 Survey tools listing Screen where all tolls are showing in inline scroll.
 Survey tools single page where all tolls are showing in inline scroll.
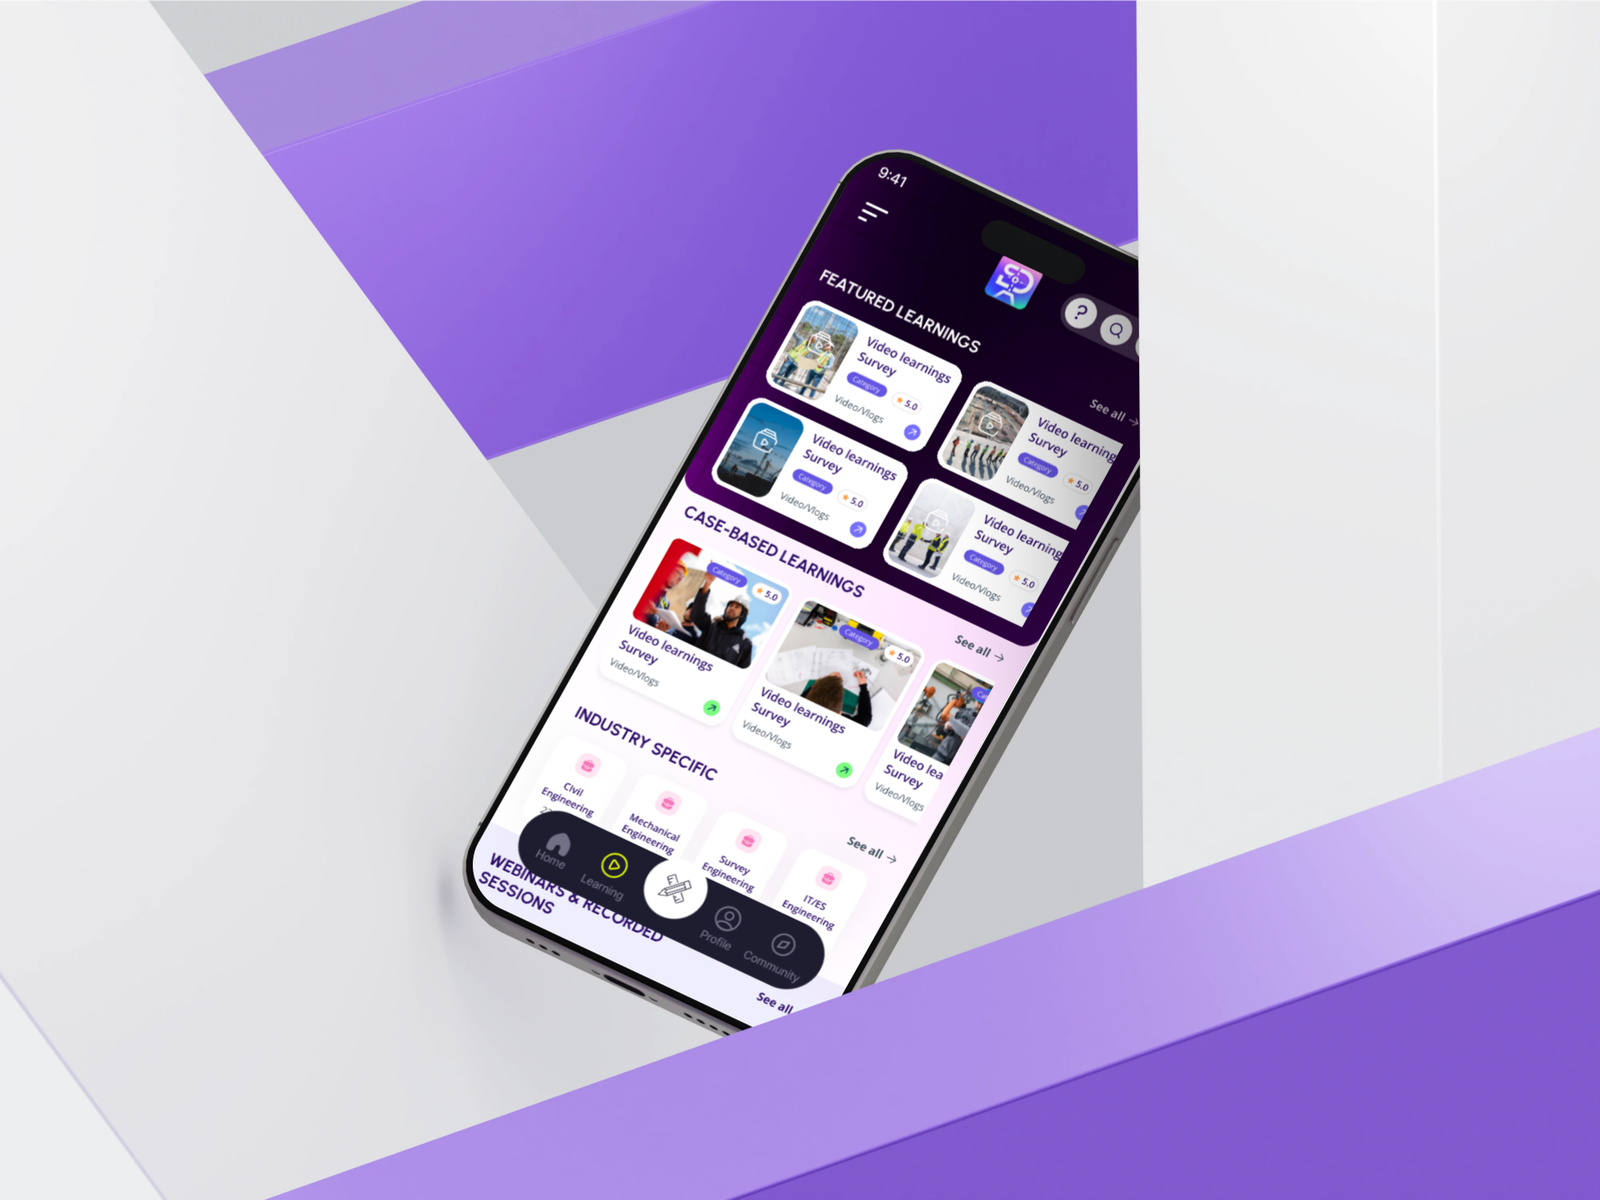 A dedicated learning section where new surveyer and tool user can know how to use this skill
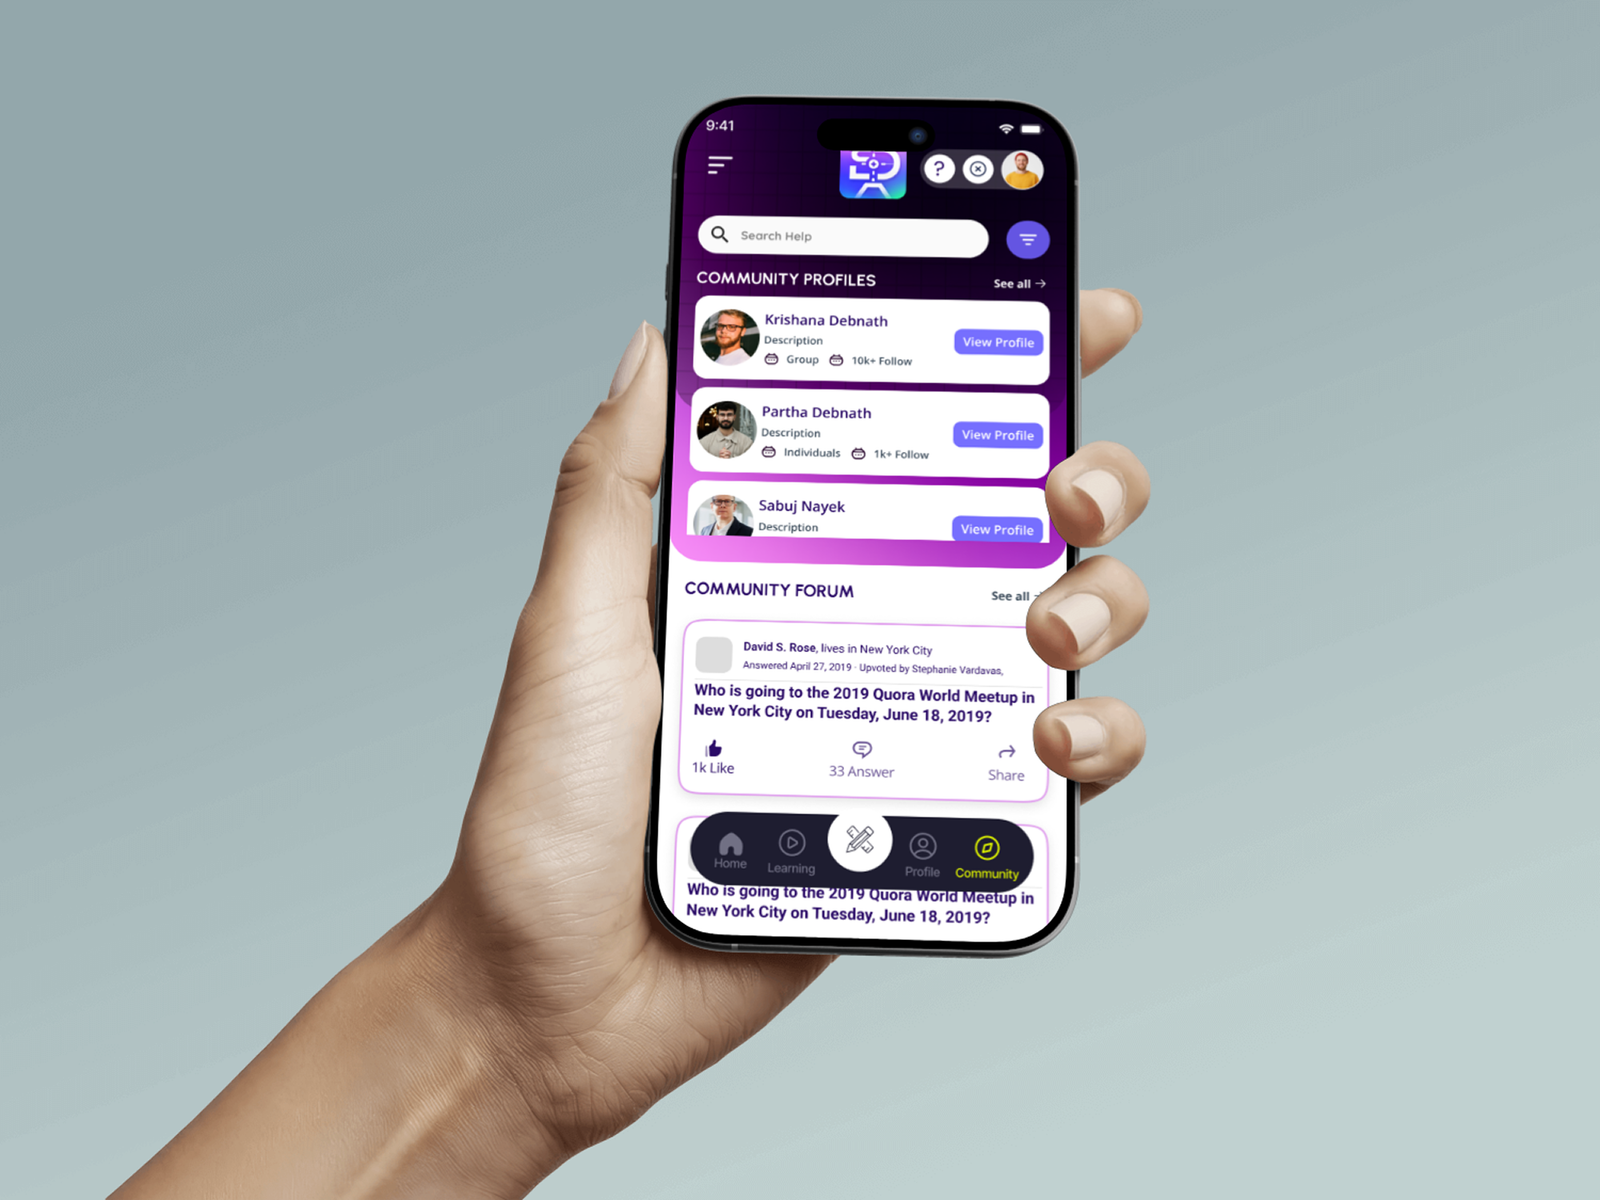 dedicated community section where users can connect with individuals and group
Interactive Prototype
A fully interactive Figma prototype was developed to simulate the complete product workflow, including onboarding, survey assignment, questionnaire completion, response submission, dashboard navigation, notifications, and profile management. Interactive transitions, validation states, and dynamic survey flows enabled stakeholders and developers to validate usability before implementation, significantly reducing development ambiguity and accelerating delivery.
Usability Testing & Impact
Testing Outcomes
Moderated usability sessions were conducted to evaluate navigation clarity, survey completion flow, onboarding efficiency, and administrator workflows. Feedback from iterative testing helped optimize form interactions, reduce cognitive load, improve mobile accessibility, and increase confidence throughout the survey experience.
- Reduced average survey completion time by 0% through improved question grouping and progressive disclosure.
- Increased mobile usability score by 0% after optimizing navigation, spacing, and interaction patterns.
- Improved administrator efficiency by 0% with reusable survey templates and JSON-driven dynamic forms.
- Increased successful survey submissions by 0% through simplified validation and clearer user feedback.
Gallery Albums
What Clients Say About This Project
No testimonials submitted yet for this project.
Submit Your Feedback
Share your experience working with me on this project. Your review will be featured dynamically.