MyBankBook
Designing an Intelligent Banking & Financial Analysis Platform for CAs and Businesses
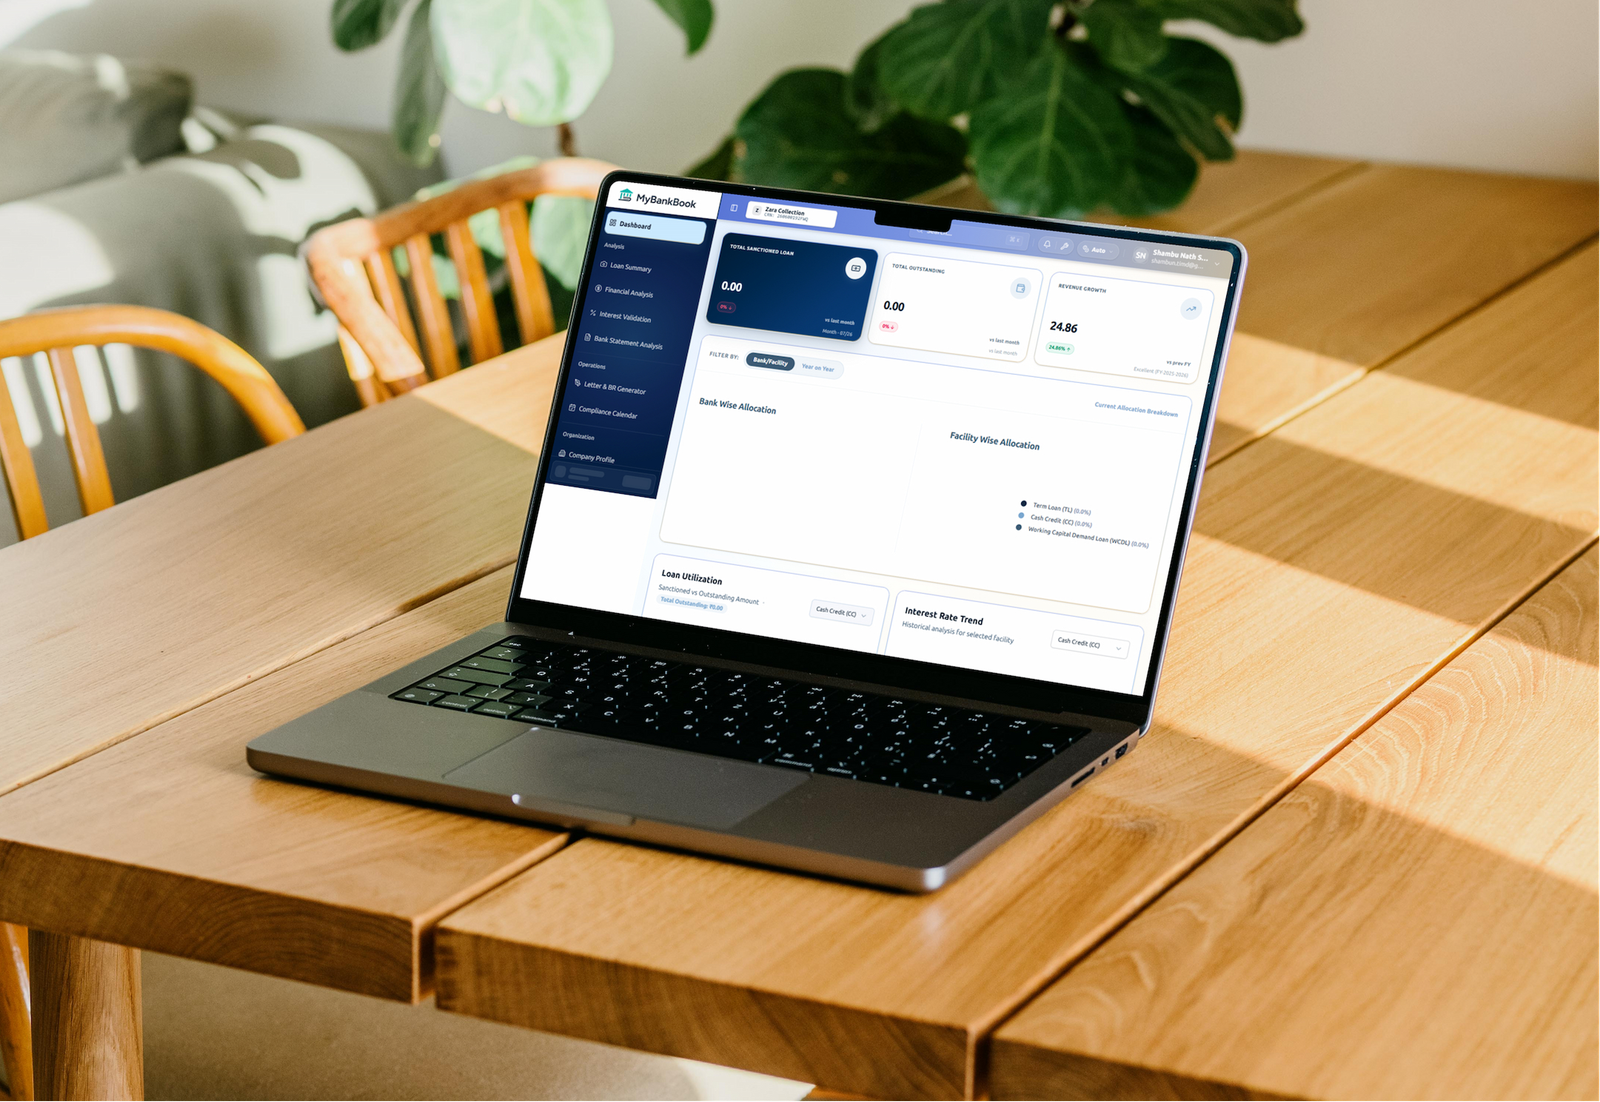
MyBankBook is a cloud-based SaaS platform built to simplify banking operations, financial analysis, compliance management, and loan documentation for Chartered Accountants (CAs), financial consultants, NBFCs, MSMEs, and businesses. The platform automatically analyzes bank statements, generates financial reports, calculates drawing power, validates interest charges, tracks compliance deadlines, and provides intelligent financial insights through interactive dashboards.
The objective was to replace manual spreadsheet-driven financial analysis with a modern, centralized SaaS platform that enables finance professionals to manage multiple companies, automate repetitive calculations, generate reports instantly, and make data-driven financial decisions. As the Lead Product Designer, I designed an enterprise-grade dashboard focused on efficiency, clarity, scalability, and usability across complex financial workflows.
The Challenge
Managing Complex Financial Workflows
Financial professionals regularly work with large volumes of banking data, loan statements, compliance records, and financial reports. The challenge was simplifying these complex workflows into an intuitive dashboard without overwhelming users.
Reducing Manual Spreadsheet Dependency
Most calculations—including drawing power, interest validation, ratio analysis, and financial reporting—were performed manually using Excel. The platform needed to automate these repetitive tasks while maintaining complete transparency.
Supporting Multi-Company Financial Management
Chartered Accountants manage multiple clients simultaneously. The dashboard needed to provide seamless company switching, centralized reporting, and role-based access without disrupting ongoing workflows.
Visualizing Large Financial Datasets
Bank statements, loan summaries, financial statements, compliance schedules, and KPI reports contain large amounts of numerical information that needed to be presented through clean, understandable visualizations.
Automating Regulatory Compliance
Users required reminders for statutory deadlines, document renewals, financial submissions, and banking obligations without relying on manual tracking systems.
Creating an Enterprise-Grade SaaS Experience
The platform needed to balance professional financial software requirements with modern UX principles, ensuring speed, accessibility, and ease of use across desktop environments.
User Research & Insights
Financial Professionals Spend Significant Time on Manual Analysis
Research revealed that CAs and finance teams spend several hours manually reviewing bank statements, reconciling transactions, and preparing financial reports. Automation became the highest-priority requirement.
Quick KPI Visibility Improves Decision Making
Users preferred dashboards that immediately display outstanding balances, sanctioned loans, utilization, revenue trends, compliance status, and financial ratios before navigating deeper into reports.
Bank Statement Analysis is the Primary Workflow
The majority of daily activities revolve around uploading, reviewing, comparing, and analyzing bank statements. Designing this workflow as the platform's core experience significantly improved usability.
Role-Based Dashboards Reduce Cognitive Load
Different users—including Chartered Accountants, business owners, finance managers, and auditors—require different information. Personalized dashboards improve efficiency by surfacing only relevant data.
Interactive Visualizations Improve Financial Understanding
Users interpret trends faster through charts, allocation graphs, KPI cards, comparison dashboards, and financial visualizations than through large spreadsheets.
Compliance Automation Prevents Costly Delays
Missing statutory deadlines often leads to penalties and operational risks. Automated compliance calendars and reminder systems significantly reduce missed obligations.
Integrated Financial Tools Increase Productivity
Providing EMI calculators, drawing power calculators, interest validation, ratio analysis, loan eligibility tools, and report generators within one platform eliminates dependency on external software.
Enterprise Users Prioritize Speed and Simplicity
Users preferred clean layouts, minimal navigation depth, keyboard-friendly interactions, searchable interfaces, and responsive dashboards that enable quick access to financial information.
Ideation & Logic
Designing a Unified Financial Workspace for Modern Accounting Teams
The experience was structured around real financial workflows instead of software modules. Every screen is designed to help users move naturally from uploading financial data to analyzing performance, generating reports, monitoring compliance, validating banking information, and making informed financial decisions. Information hierarchy, reusable components, and contextual actions ensure the platform remains efficient despite handling highly complex financial datasets.
Manage multiple organizations, upload financial records, and centralize banking information within one secure workspace.
Review loan summaries, financial statements, bank transactions, KPIs, utilization reports, and interactive dashboards.
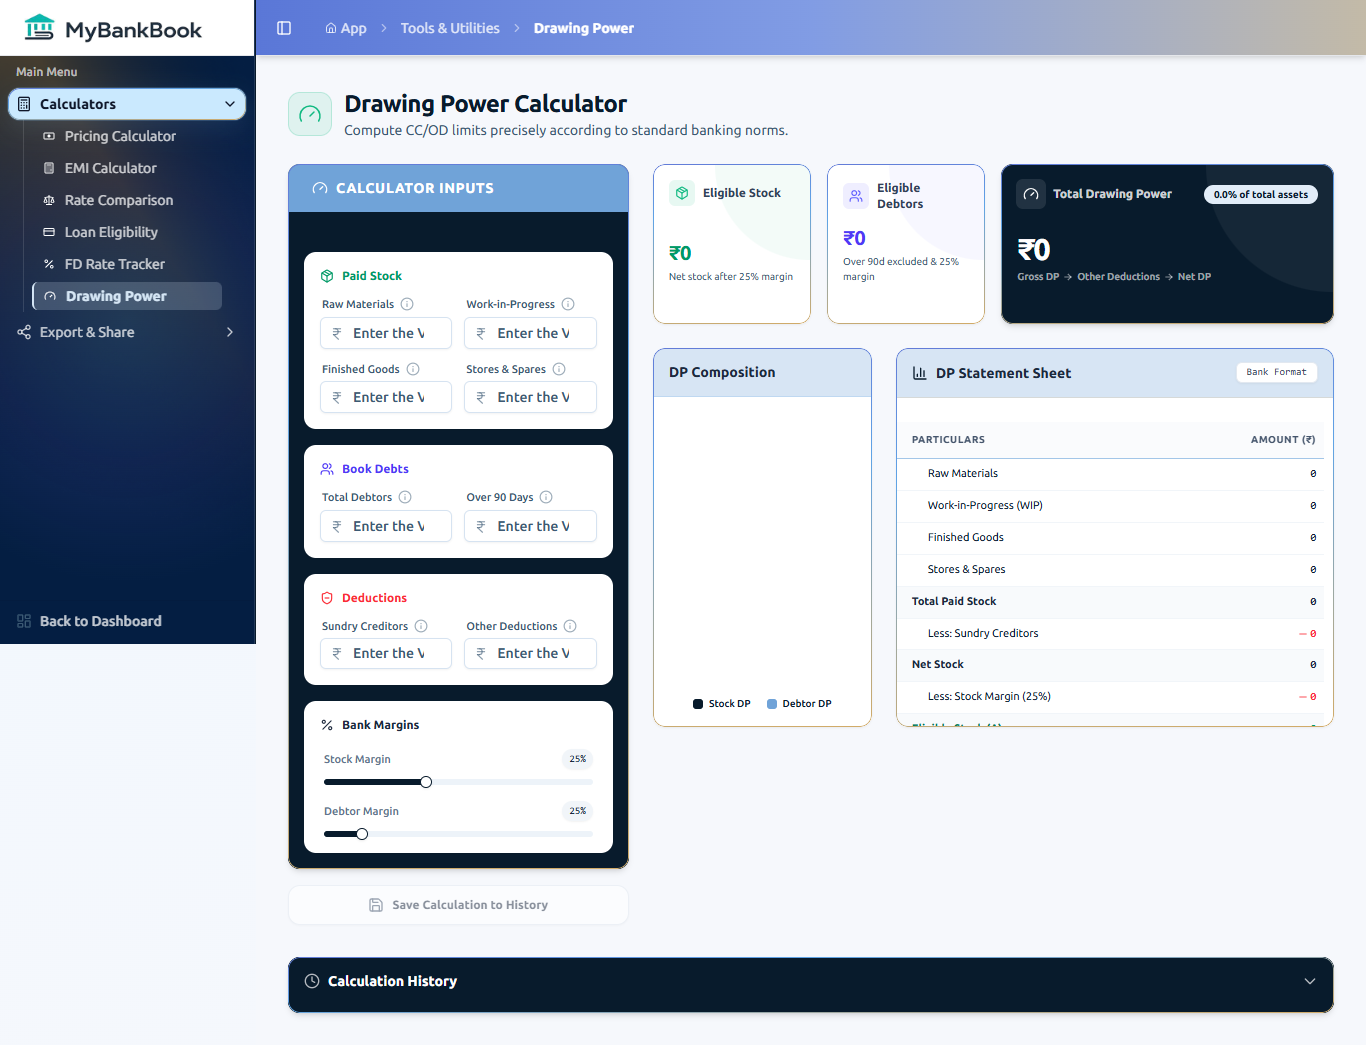
Generate drawing power, EMI calculations, interest validation, financial ratios, and accounting insights automatically.
Monitor compliance calendars, statutory deadlines, financial documents, loan letters, and regulatory requirements.
Export professional reports, monitor business performance, identify financial risks, and support faster decision-making through data-driven insights.
Design System & UI Kit
Enterprise Financial Design System
The design language combines professional banking aesthetics with modern SaaS usability. Clean layouts, structured data tables, reusable KPI cards, interactive charts, financial widgets, standardized forms, and accessible navigation establish a scalable enterprise interface capable of supporting hundreds of financial workflows while maintaining clarity and consistency.
Typography & Components
- Ubuntu "Ubuntu Fallback", ui-sans-serif
Final Visual Design
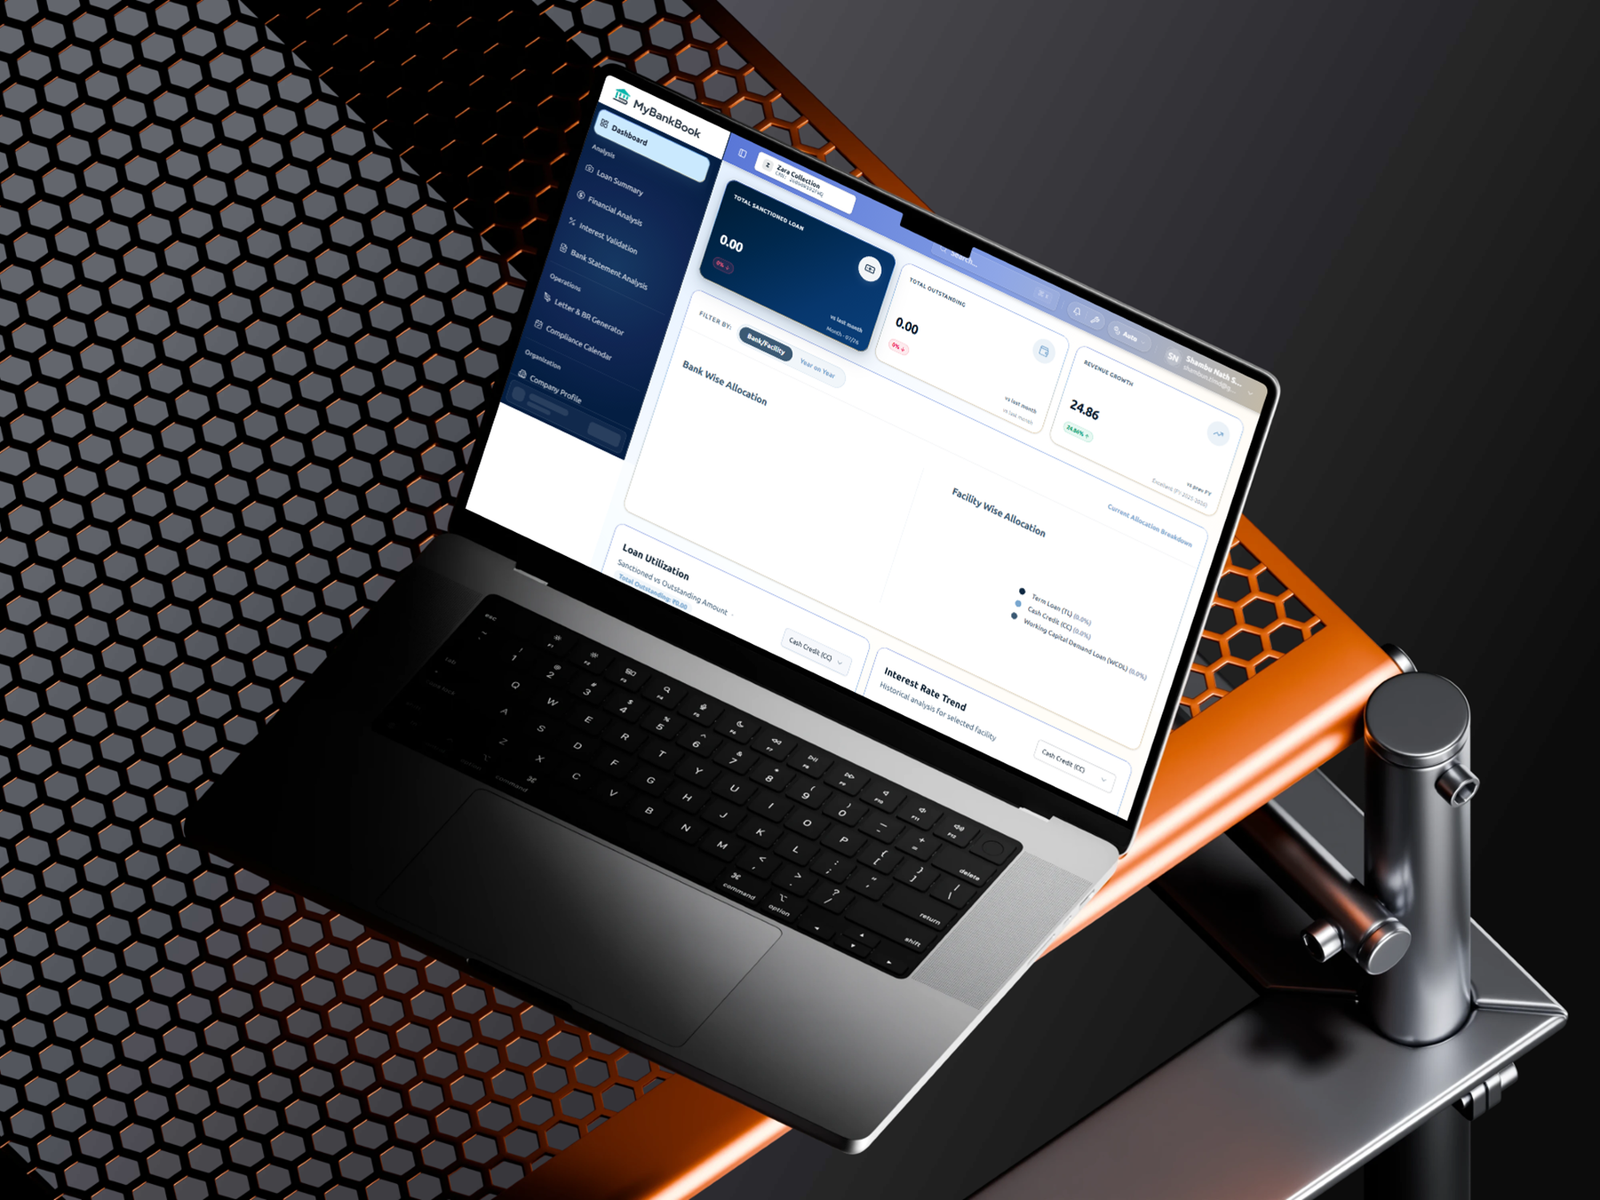 A modern enterprise SaaS dashboard that transforms banking analysis, financial reporting, compliance tracking, and accounting workflows into an intelligent, data-driven experience for Chartered Accountants and finance professionals.
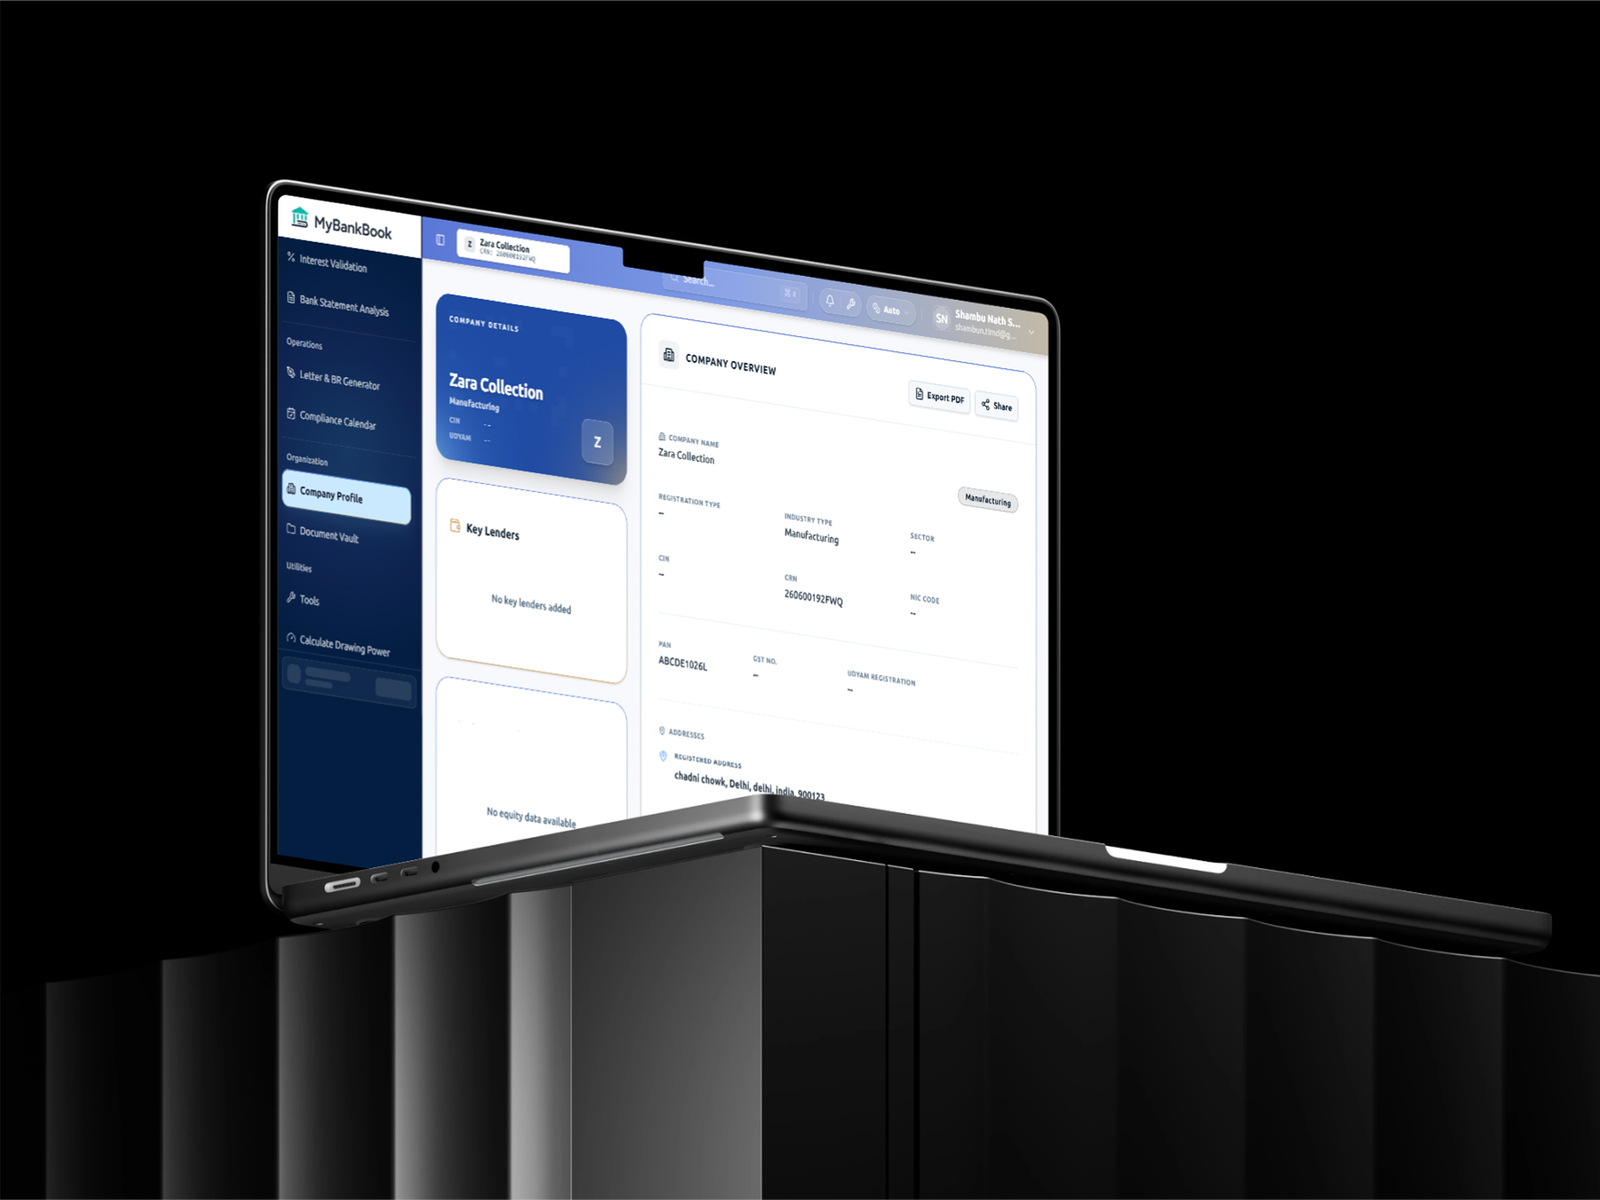 Company Profile
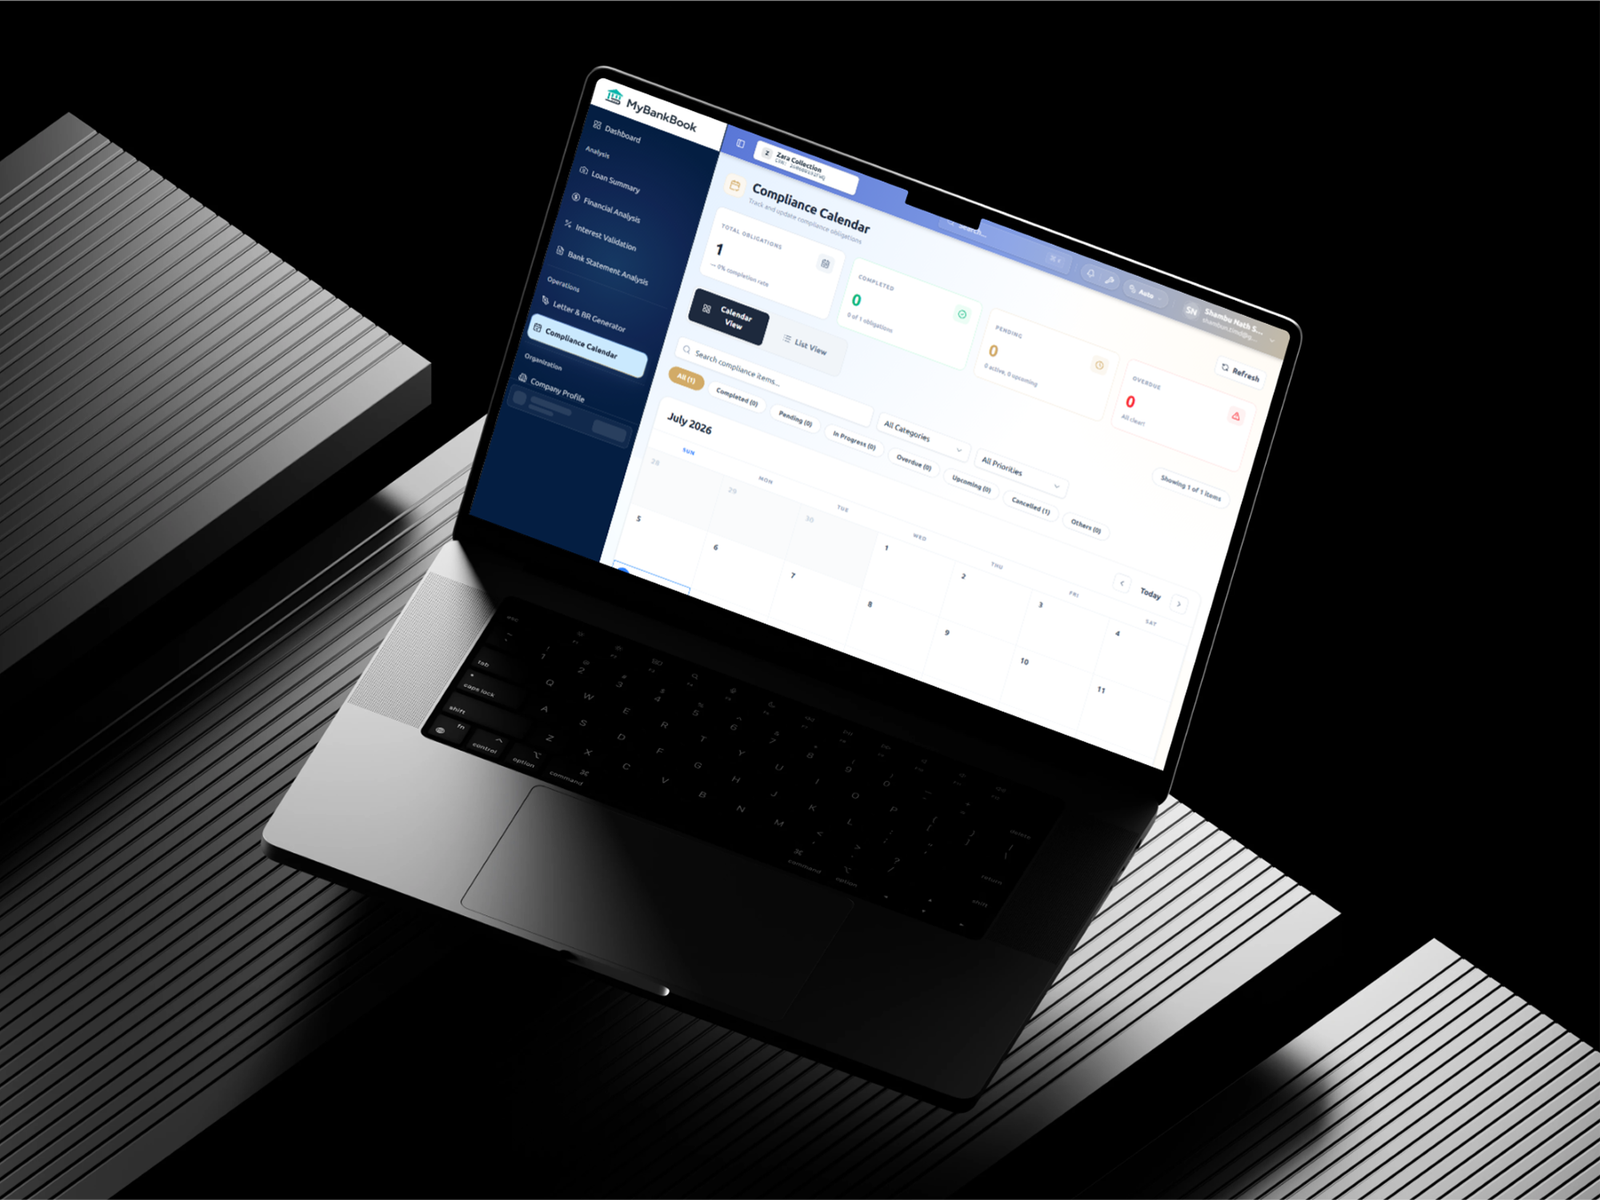 Compliance Calander
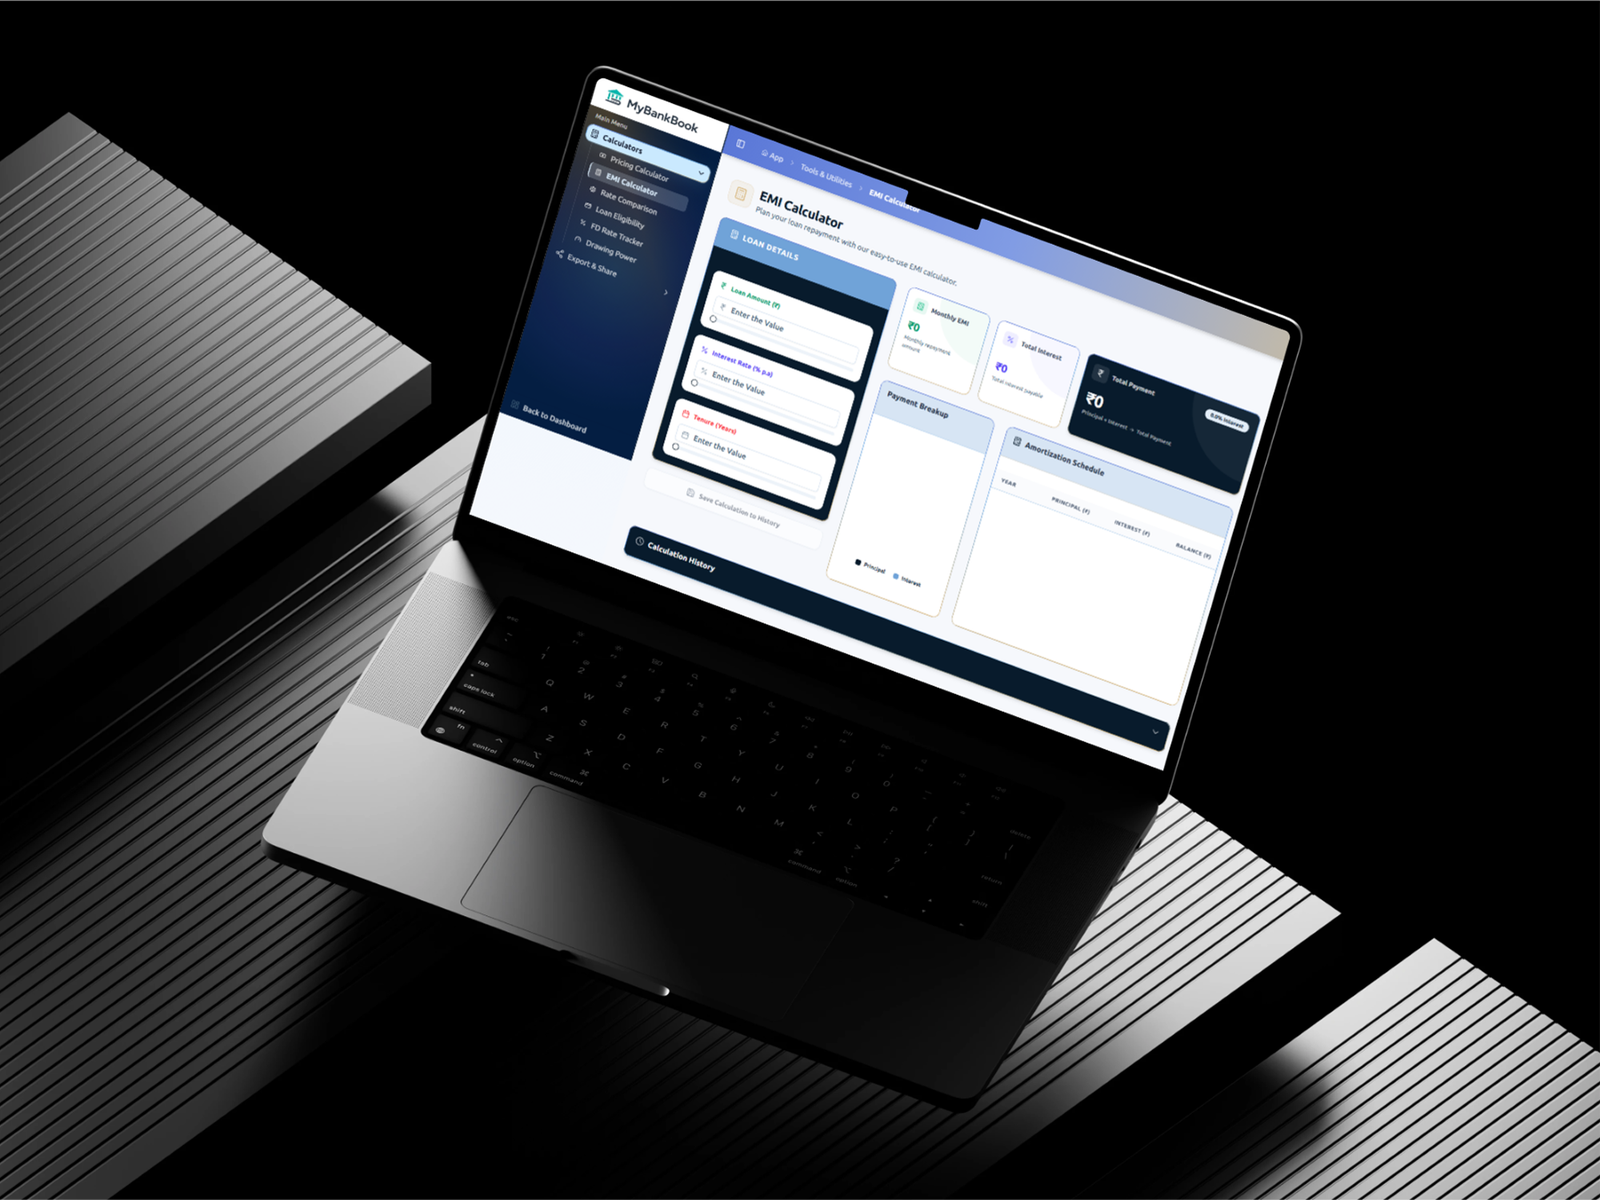 Tools for finance
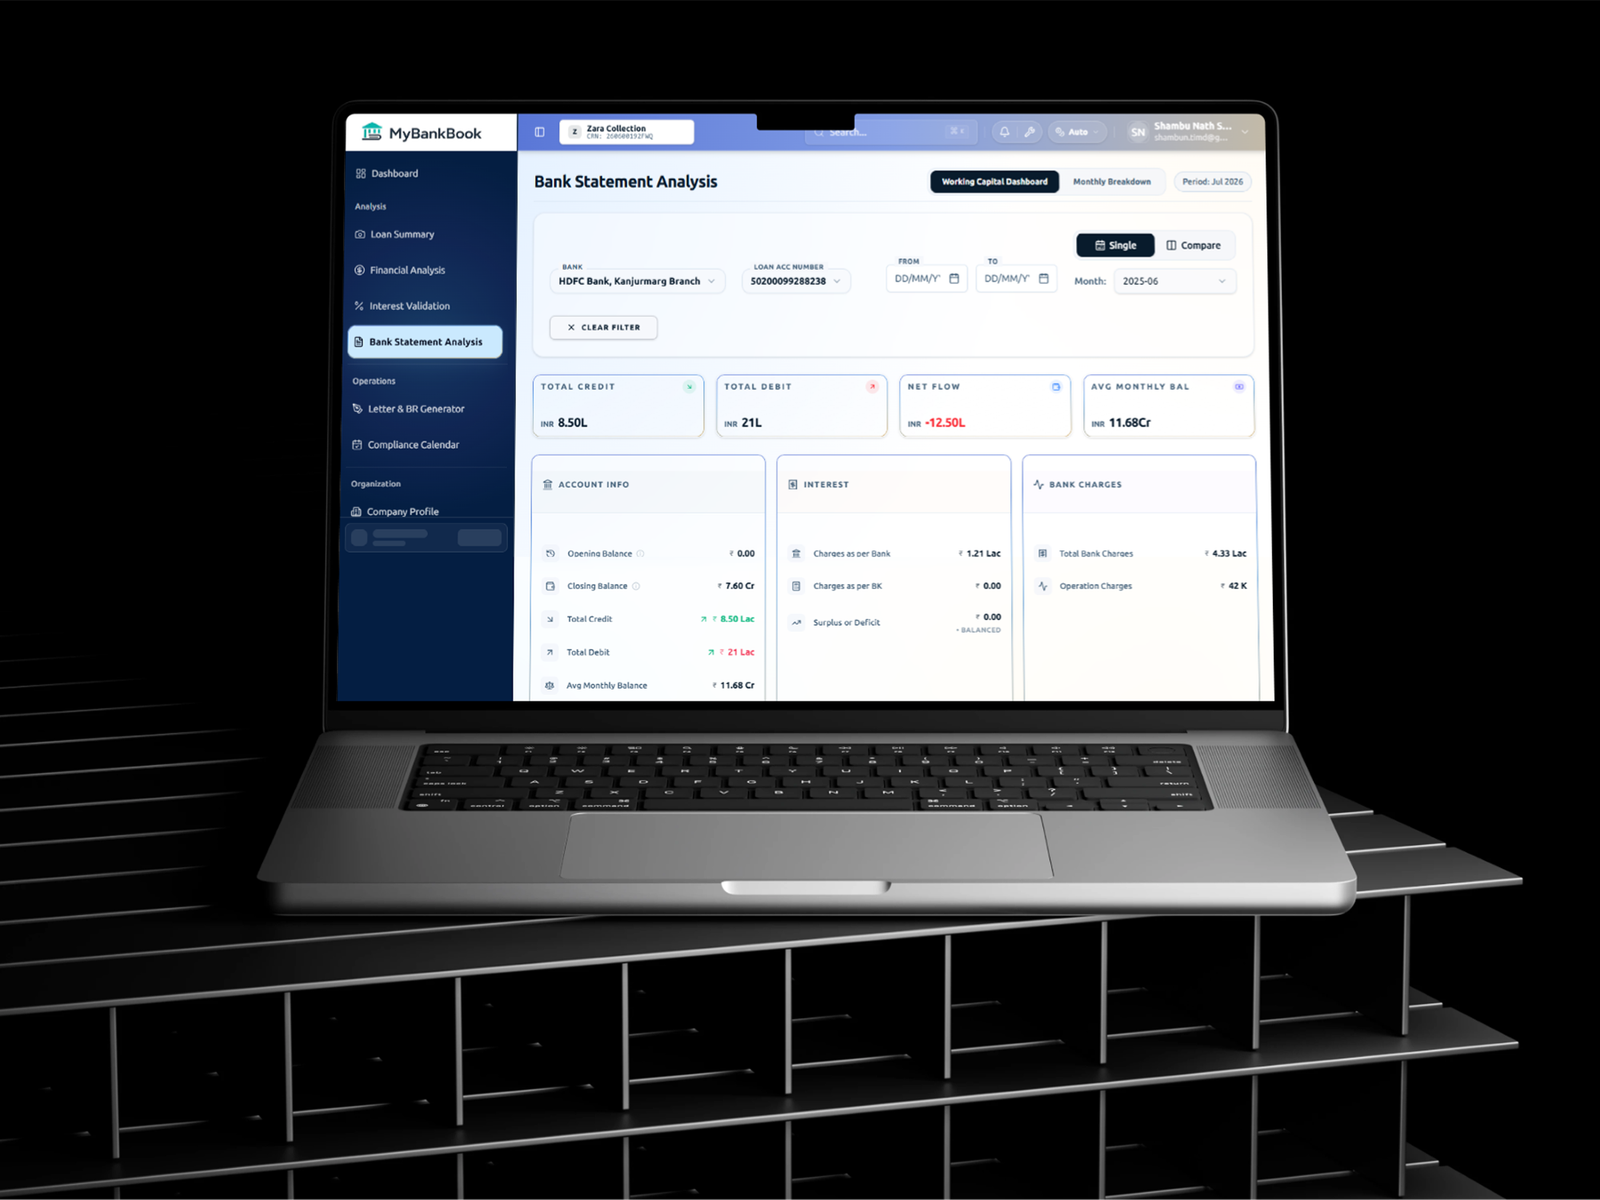 Bank Satement Analysis
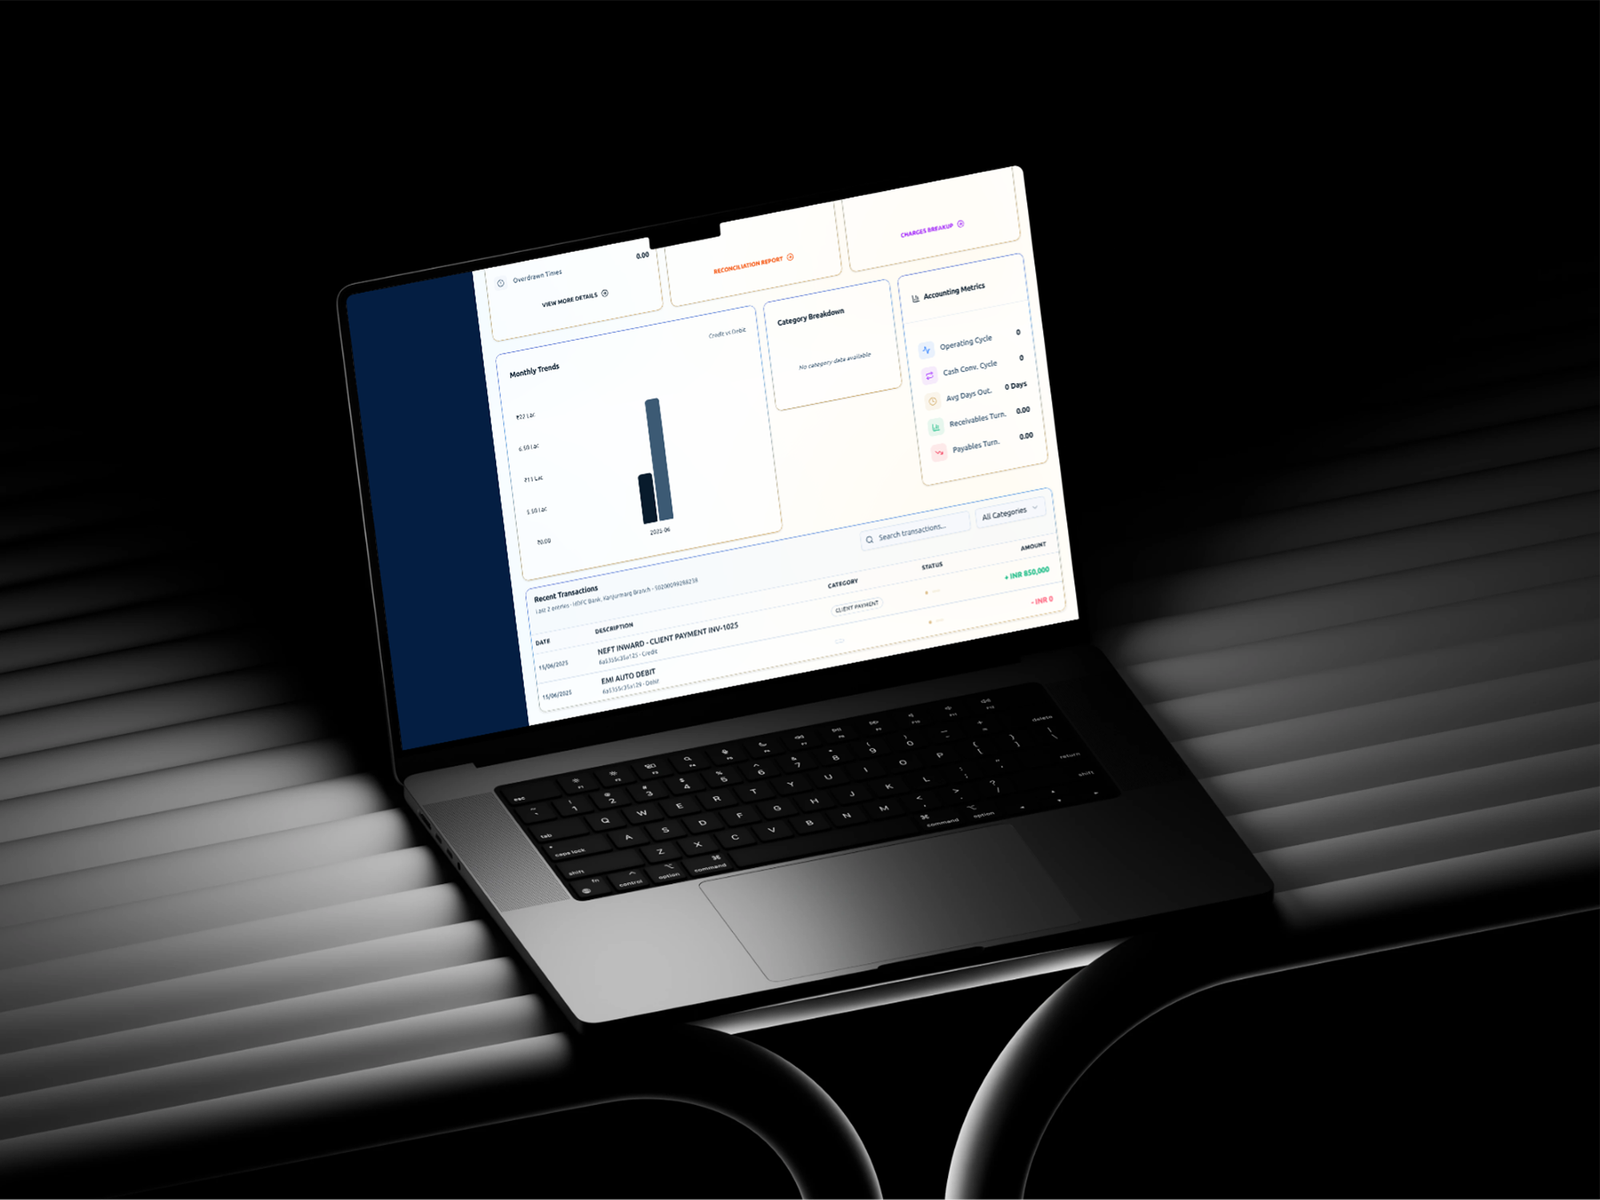 Statement Statistics
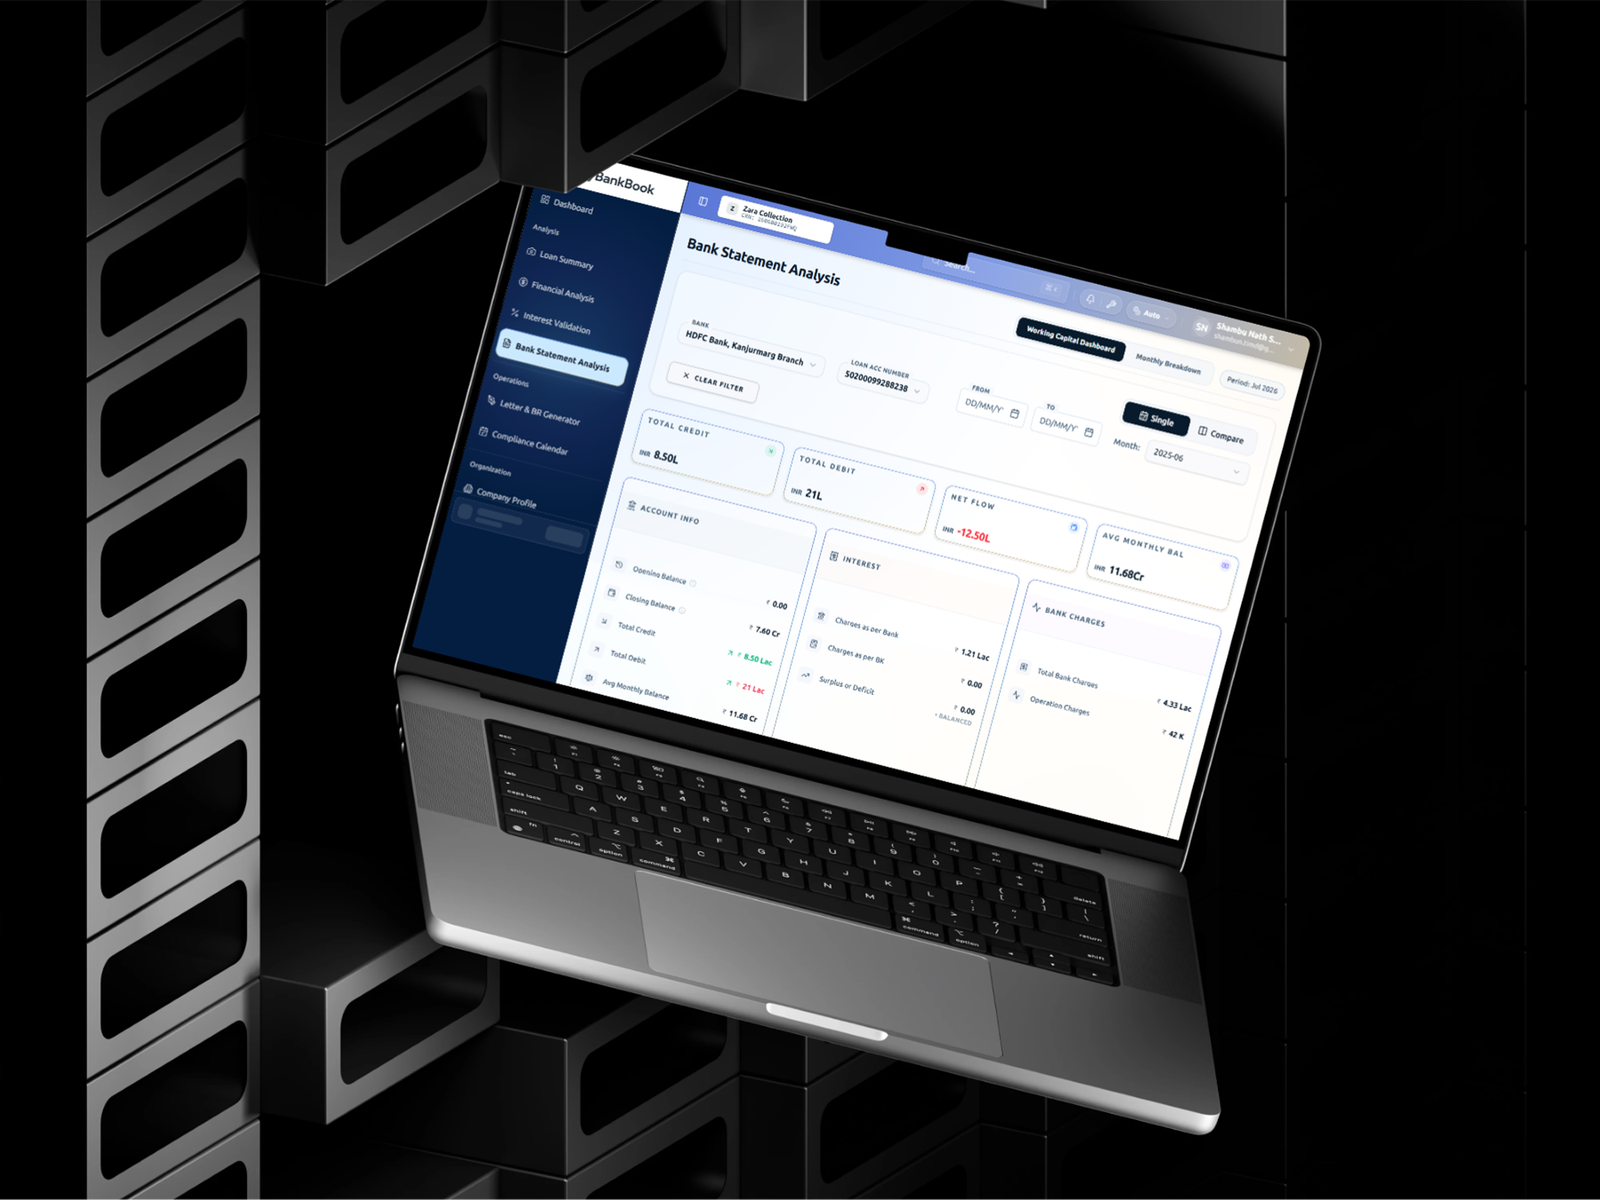 Bank Statement Analysis
Interactive Prototype
A high-fidelity interactive prototype was developed covering the complete SaaS ecosystem, including authentication, company management, banking dashboards, financial statements, bank statement analysis, drawing power calculations, compliance tracking, EMI calculators, reporting modules, document management, and interactive financial visualizations. The prototype enabled stakeholders to validate business workflows, navigation efficiency, and enterprise usability before development while ensuring scalability for future banking and accounting modules.
Usability Testing & Impact
Testing Outcomes
Usability testing involved Chartered Accountants, finance managers, auditors, and business owners performing real-world accounting tasks such as reviewing bank statements, analyzing financial statements, generating reports, monitoring compliance, and using financial calculators. Feedback improved dashboard hierarchy, reduced navigation complexity, enhanced report discoverability, simplified financial visualizations, and optimized enterprise workflows. The final SaaS platform significantly reduced manual effort while improving financial accuracy and operational productivity.
- Reduced manual financial analysis time by 0% through automated banking workflows and intelligent reporting.
- Improved report generation efficiency by 0% using centralized financial dashboards and export automation.
- Increased compliance tracking accuracy by 0% with automated reminders, calendars, and workflow management.
- Enhanced overall productivity by 0% through integrated financial tools, multi-company management, and streamlined enterprise workflows.
Gallery Albums
What Clients Say About This Project
No testimonials submitted yet for this project.
Submit Your Feedback
Share your experience working with me on this project. Your review will be featured dynamically.