ICL SaaS Dashboard
Designing a Scalable Multi-Tenant Enterprise SaaS Dashboard
ICL is a cloud-based enterprise SaaS platform built to manage companies, customers, subscriptions, services, courses, transactions, exports, reports, analytics, user management, and role-based administration from a single centralized dashboard.
The primary objective was to build a modern SaaS interface capable of supporting multiple business modules while maintaining speed, scalability, and consistency across hundreds of screens. The platform serves Super Admins, Companies, Employees, Customers, and Operations Teams with role-specific dashboards and permission-driven workflows.
As the Lead UI/UX Designer, I designed a complete enterprise design system, modular dashboard architecture, reusable components, analytics dashboards, export center, administration modules, and responsive experiences that simplify complex business operations into intuitive workflows.
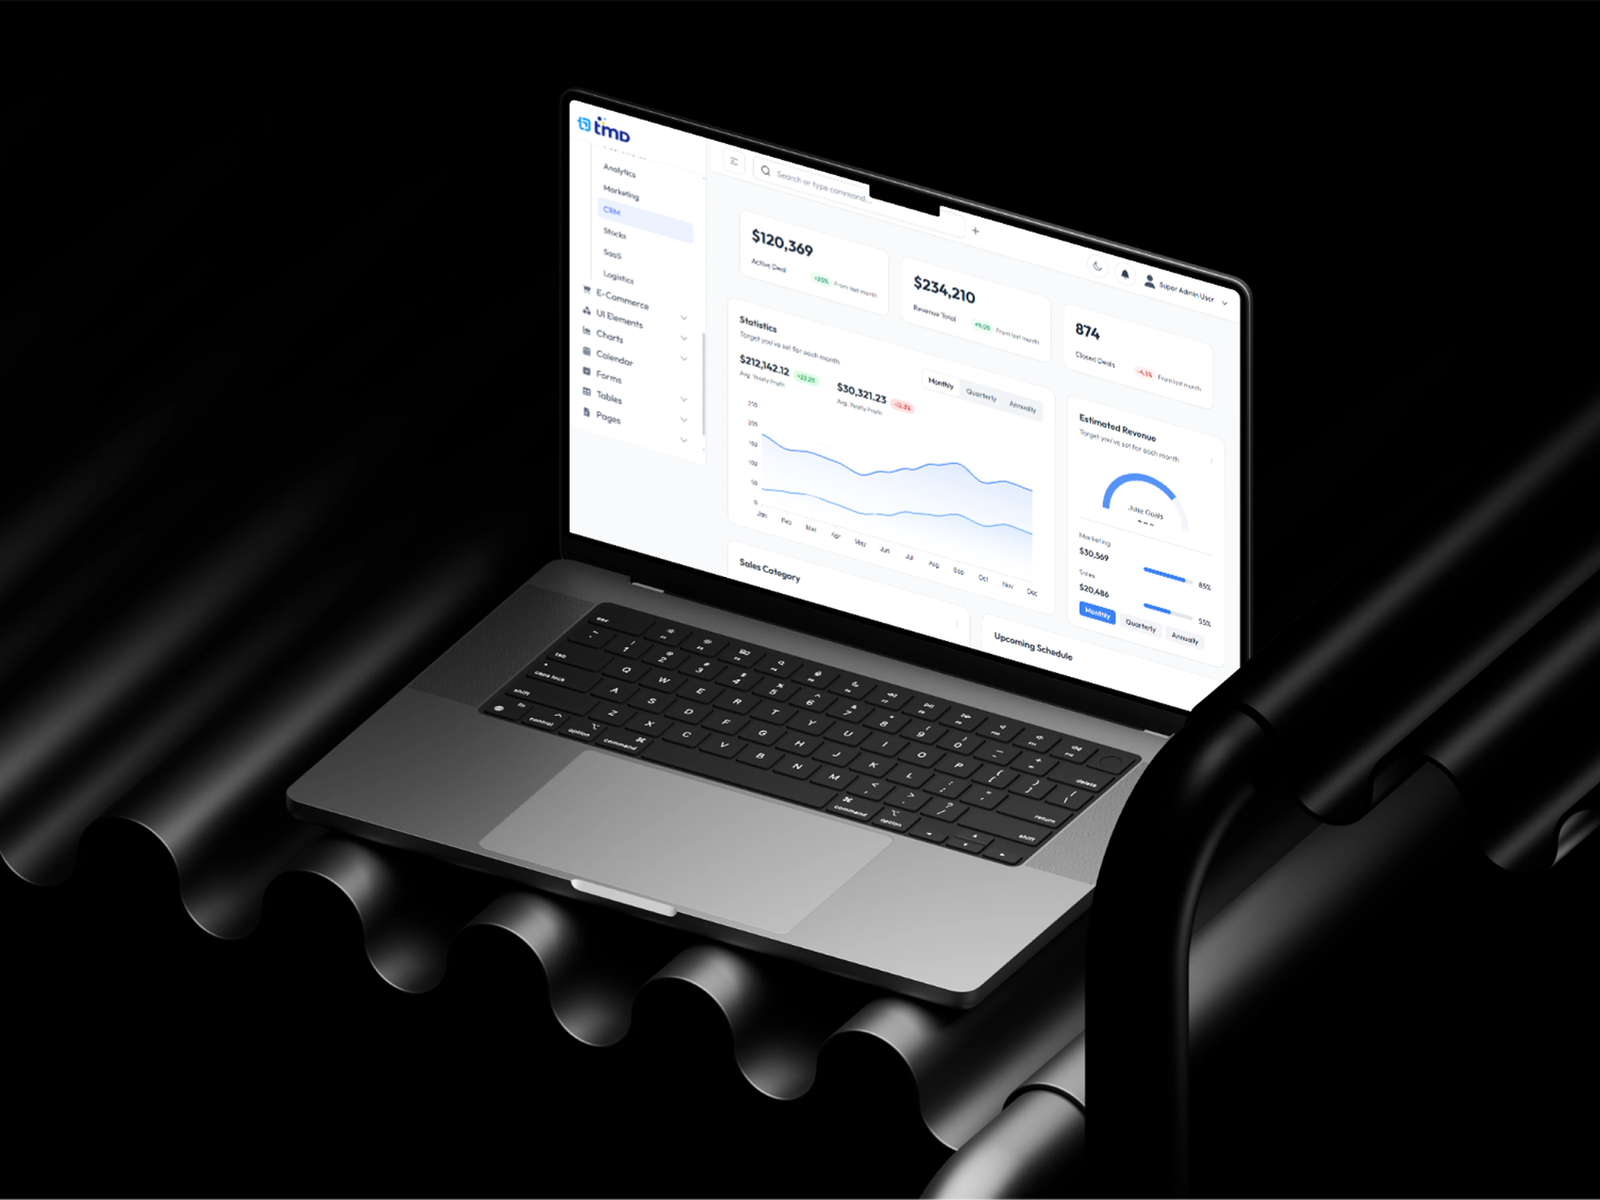
The Challenge
Managing Large Enterprise Modules
The platform contains numerous interconnected business modules including CRM, subscriptions, exports, services, companies, users, analytics, finance, and administration. Designing a navigation system that remains simple while supporting future scalability was one of the biggest UX challenges.
Supporting Multiple User Roles
Different user types require completely different permissions, dashboards, navigation, and actions. The interface needed to dynamically adapt while maintaining a consistent user experience across all roles.
Simplifying Data-Heavy Workflows
Enterprise users work with large datasets, reports, exports, tables, filters, and analytics daily. Reducing cognitive load through better hierarchy, visual grouping, and reusable interaction patterns became essential.
Creating a Scalable Design System
Hundreds of screens needed to maintain visual consistency. Building reusable components, standardized spacing, typography, colors, cards, tables, filters, and form elements ensured efficient product scaling and faster development.
User Research & Insights
Users Prioritize Quick Access to Key Metrics
Research revealed that administrators primarily open the dashboard to monitor KPIs, revenue, subscriptions, customers, and operational performance. Important metrics should be visible immediately without navigating through multiple pages.
Tables Remain the Core Enterprise Interface
Enterprise users spend most of their working hours inside tables rather than dashboards. Features such as bulk actions, search, filtering, sorting, pagination, exports, and quick actions significantly improve operational efficiency.
Advanced Filtering Improves Productivity
Users frequently retrieve information using status filters, date ranges, company filters, transaction types, and search. Consolidating these controls into consistent filter components reduces interaction time and improves workflow efficiency.
Role-Based Navigation Reduces Cognitive Load
Showing only the modules, actions, and permissions relevant to each user role simplifies navigation, minimizes confusion, and creates a cleaner enterprise experience without sacrificing functionality.
Visual Analytics Improve Decision Making
Charts, KPI cards, gauges, progress indicators, and comparison metrics allow administrators to identify trends faster than reading raw reports. Interactive dashboards improve monitoring and executive decision-making.
Export Workflows Are Business-Critical
Business users regularly export customer data, financial reports, transactions, services, and analytics into multiple formats. Simplifying export configuration with guided workflows significantly reduces operational errors.
Consistency Increases Enterprise Adoption
Using identical interaction patterns for forms, tables, filters, buttons, and modals reduces the learning curve for new users while improving overall platform usability.
Responsive Dashboards Support Modern Workstyles
Decision-makers increasingly access enterprise platforms from laptops, tablets, and mobile devices. Responsive layouts and adaptive dashboards improve productivity outside traditional office environments.
Ideation & Logic
Building a Modular Enterprise Operating System
Instead of designing independent screens, the product was structured as a modular enterprise ecosystem. Every module follows identical interaction patterns, reusable components, and scalable navigation, allowing users to move seamlessly between dashboards, reports, customers, services, exports, administration, and analytics. This modular approach significantly reduces cognitive load while supporting rapid product expansion.
Access KPIs, dashboards, analytics, subscriptions, revenue, customers, and operational metrics from a centralized overview.
Organize companies, services, customers, users, transactions, and business resources through structured management interfaces.
Monitor business intelligence using interactive charts, reports, filters, comparisons, and operational dashboards.
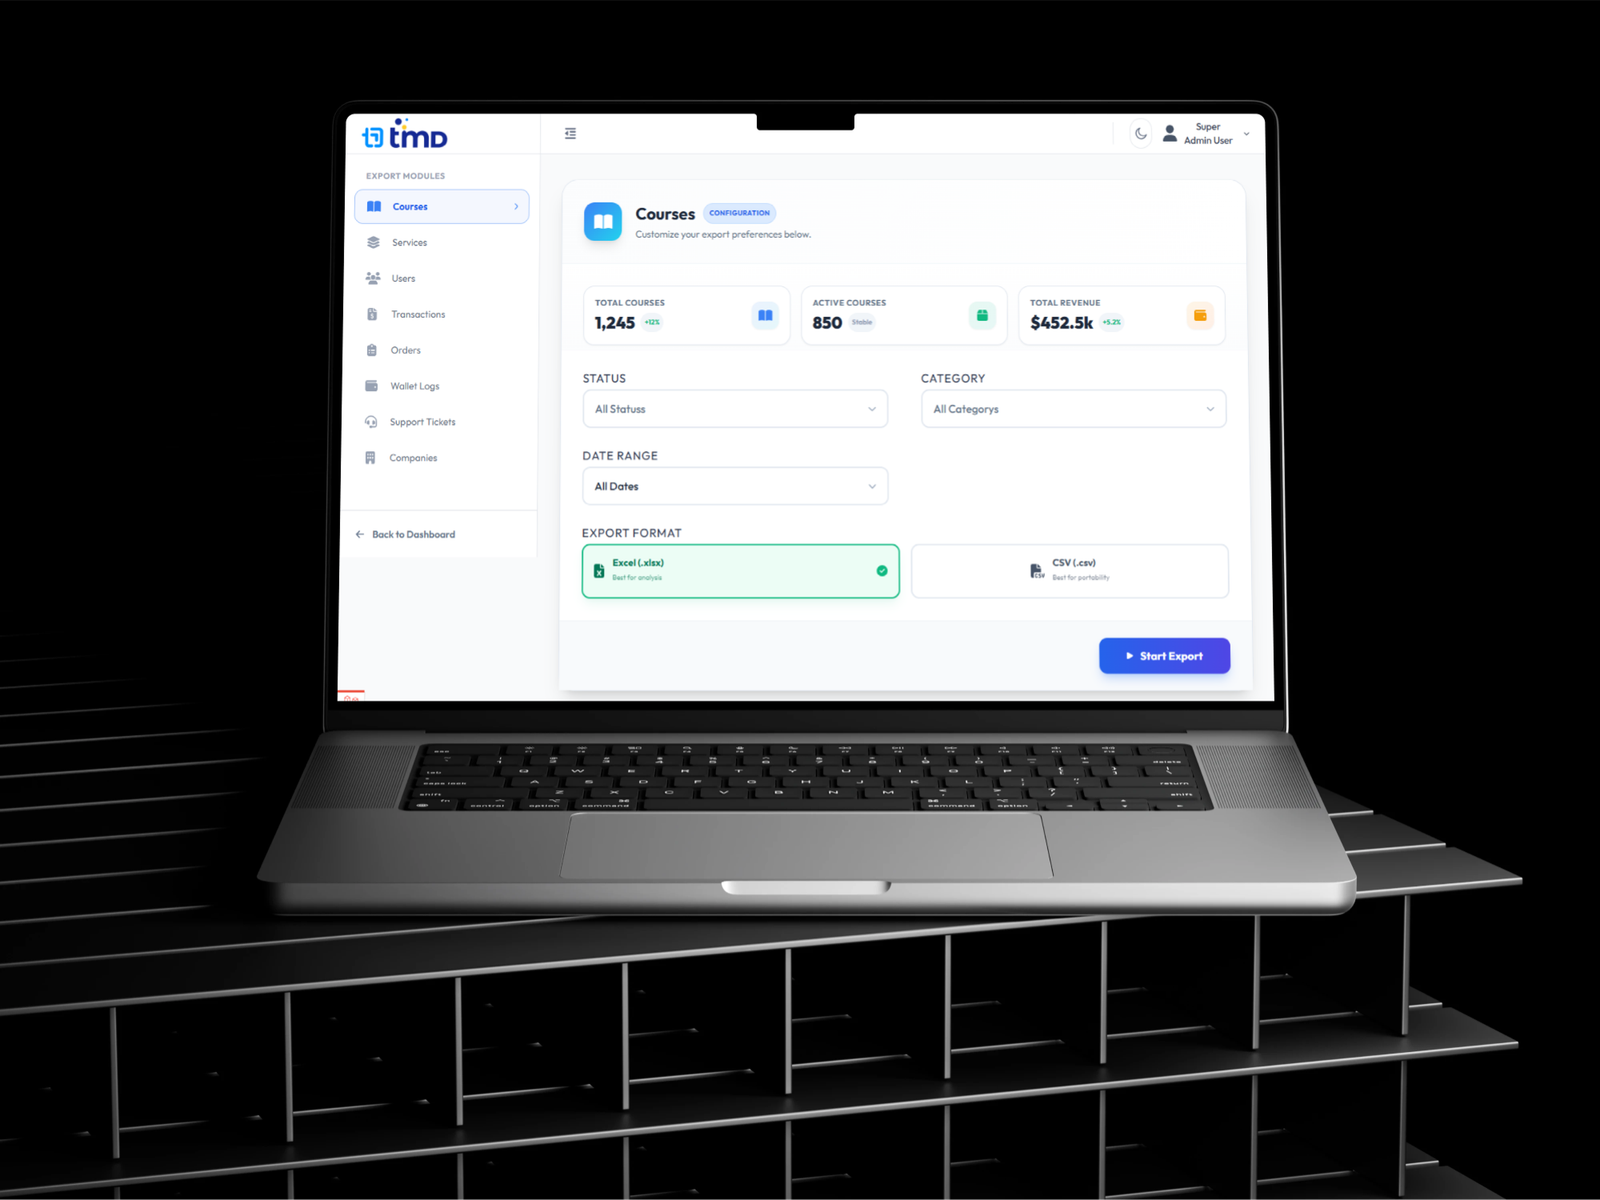
Generate configurable exports using multiple filters, date ranges, categories, and supported file formats.
Manage permissions, roles, settings, security, notifications, and platform configurations through centralized administration modules.
Wireframes & Iteration
Design System & UI Kit
A modern enterprise SaaS platform featuring modular dashboards, advanced analytics, configurable exports, role-based administration, scalable component systems, and intuitive data management workflows.
A modern enterprise SaaS platform featuring modular dashboards, advanced analytics, configurable exports, role-based administration, scalable component systems, and intuitive data management workflows.
Typography & Components
- Display Title: Plus Jakarta Sans / Bold / 5.5rem
- Section Tag: Plus Jakarta Sans / ExtraBold / 0.8rem / 0.15em spacing
- Body Copy: Plus Jakarta Sans / Medium / 1.05rem / 1.6 lineheight
FINAL VISUAL DESIGN
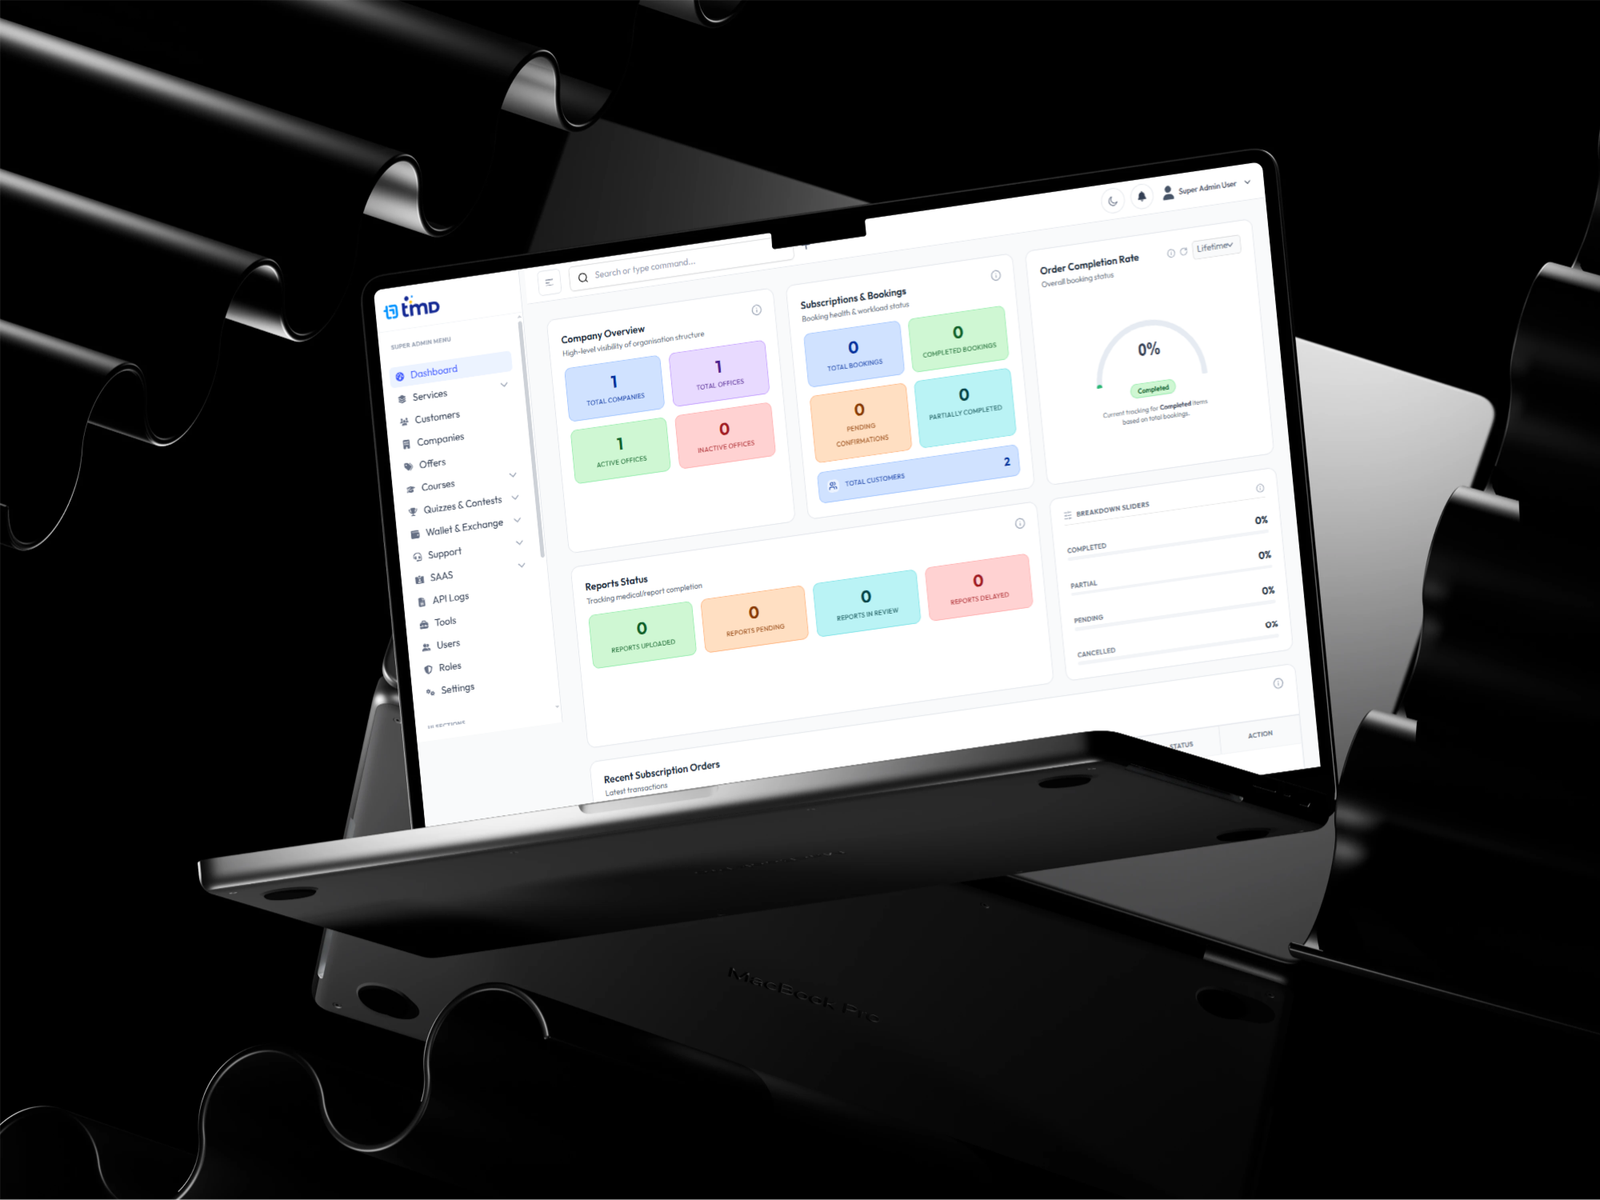 A modern enterprise SaaS platform featuring modular dashboards, advanced analytics, configurable exports, role-based administration, scalable component systems, and intuitive data management workflows.
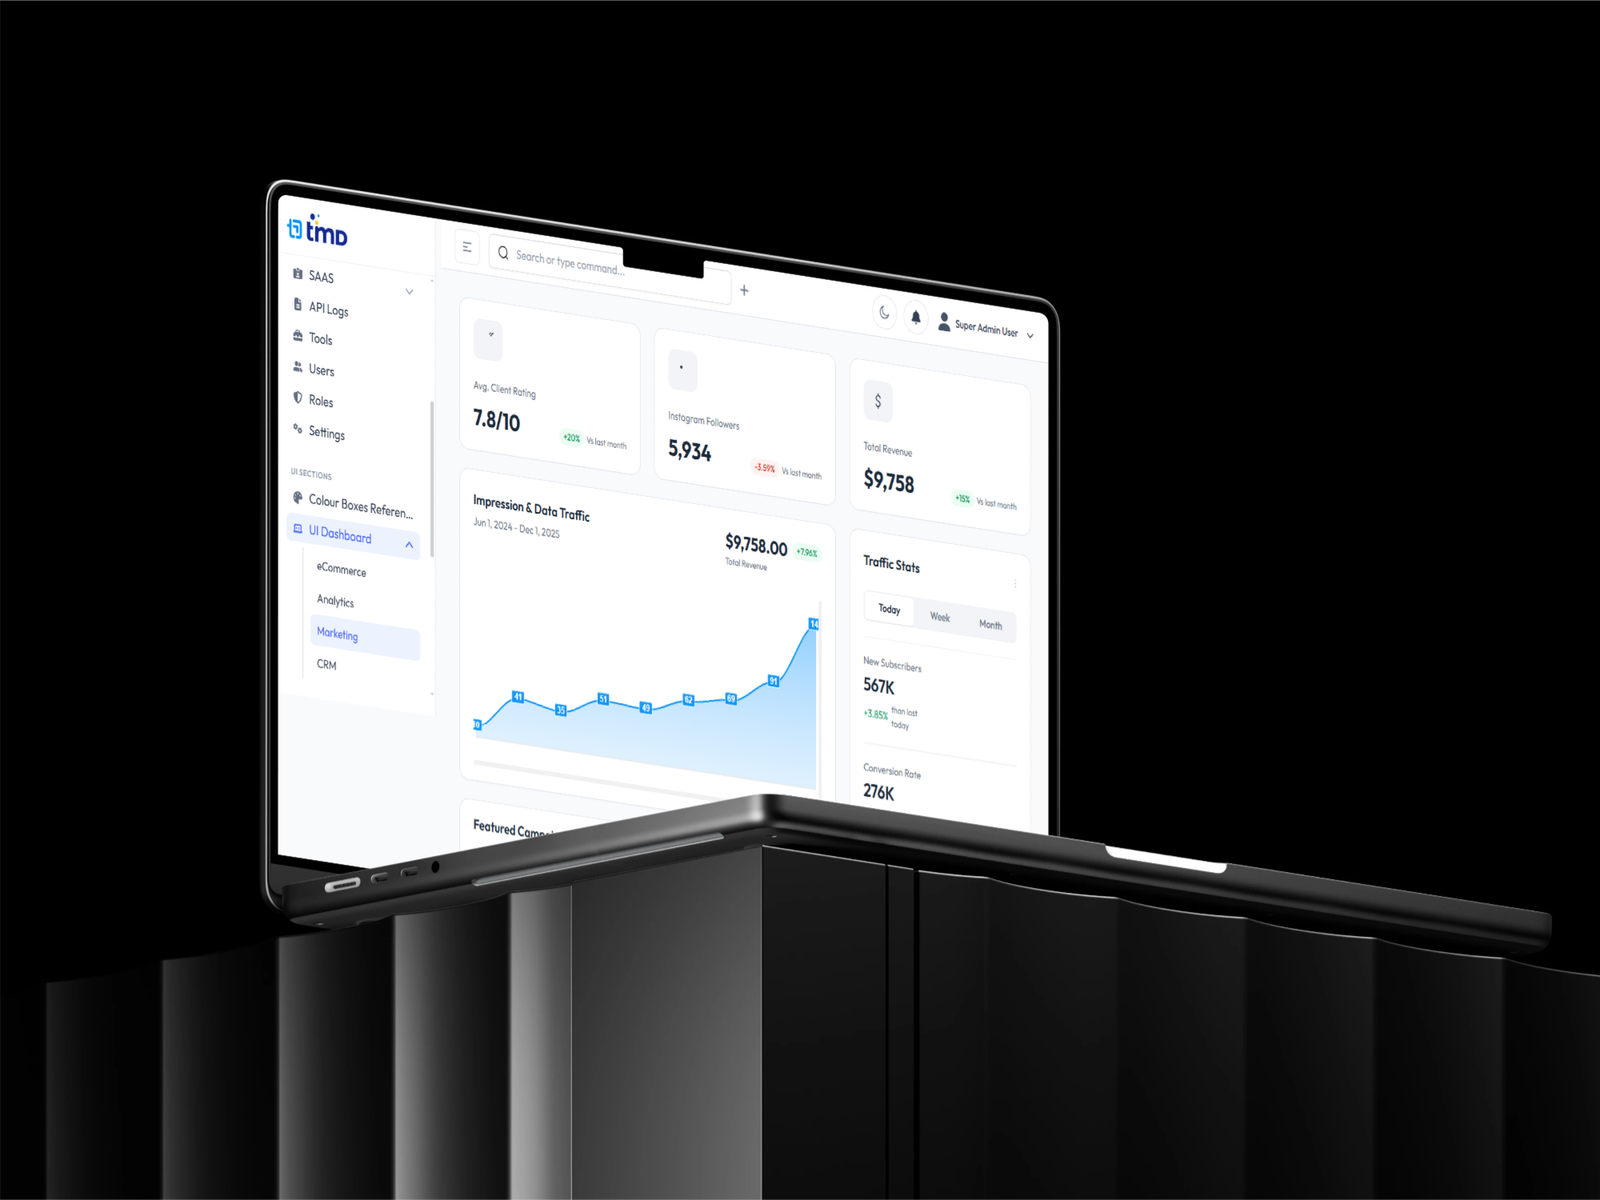 Enterprise Administration, Export Center & Data Management Modules
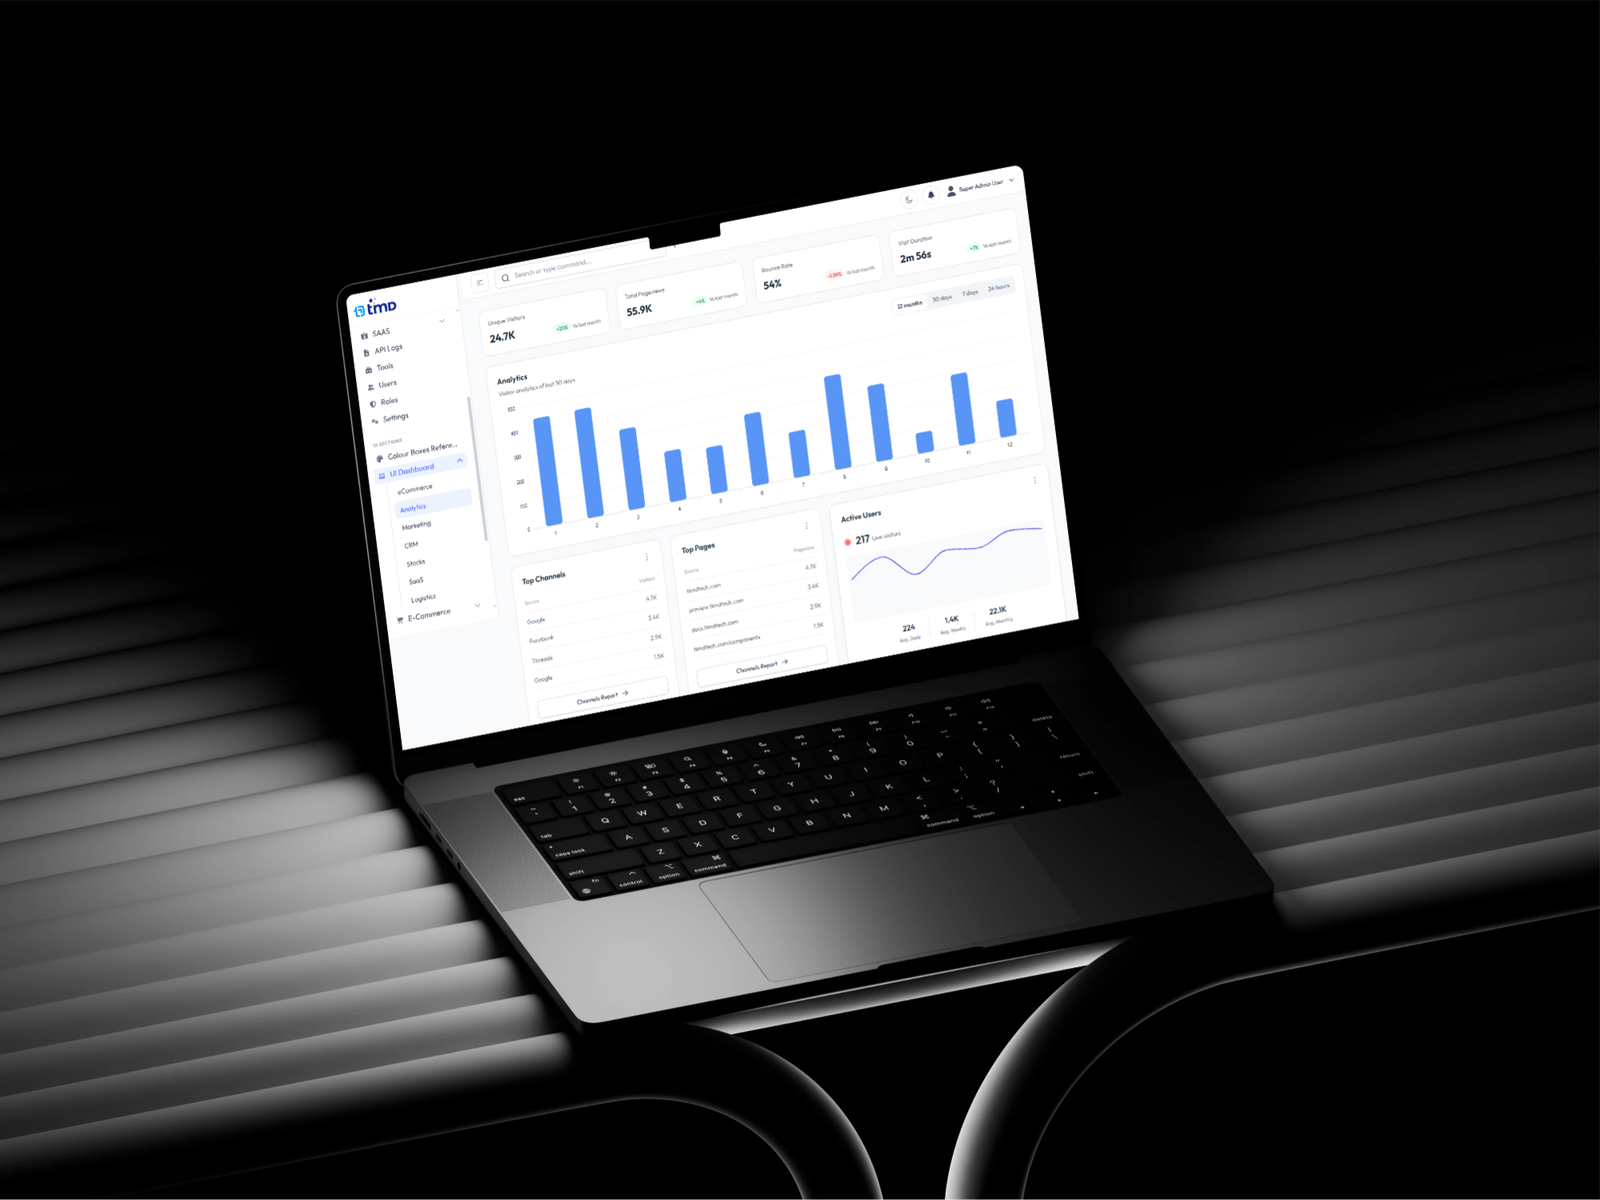 Dashboard Analytics, KPI Monitoring & Business Intelligence
Interactive Prototype
A fully interactive prototype was created to validate the complete enterprise workflow, including role-based dashboards, customer management, company administration, export configuration, transaction monitoring, analytics, reporting, user management, and platform settings. Interactive states, responsive layouts, reusable components, and realistic business scenarios allowed stakeholders and developers to validate functionality before implementation while ensuring consistency throughout the product ecosystem.
Usability Testing & Impact
Testing Outcomes
Usability testing involved administrators, operations teams, business managers, and enterprise users performing real-world tasks such as customer management, export generation, analytics review, role configuration, and reporting. Feedback was used to refine dashboard hierarchy, optimize navigation, simplify filtering, improve table interactions, and streamline export workflows. The final platform delivers a highly scalable enterprise experience that improves productivity, reduces training time, and supports long-term business growth.
- Reduced task completion time by 0% through optimized navigation, reusable workflows, and simplified enterprise interactions.
- Increased reporting efficiency by 0% using configurable exports, standardized filters, and centralized analytics.
- Improved administrator productivity by 0% with role-based dashboards, reusable components, and consistent interaction patterns.
- Reduced onboarding time for new enterprise users by 0% through intuitive navigation, standardized UI, and scalable design systems.
Gallery Albums
What Clients Say About This Project
No testimonials submitted yet for this project.
Submit Your Feedback
Share your experience working with me on this project. Your review will be featured dynamically.